discourse study-blog | resources | lit review maps | profiles - research data
enquiry research QNR | dysdefs QNR | dysdims QNR
thesis overview | literature | research design | data & analysis | discussion | conclusions
 QNR data profiles
The principal research objective is to determine if there is evidence that students who exhibit characteristics of dyslexia but who are otherwise not identified as dyslexic present a significantly different academic (behavioural) confidence (ABC) level in comparison to a group of peers who are known to have a dyslexic learning difference, with both groups' ABC measured against a control group of peers who exhibit no indications of dyslexia as part of their learning profile.
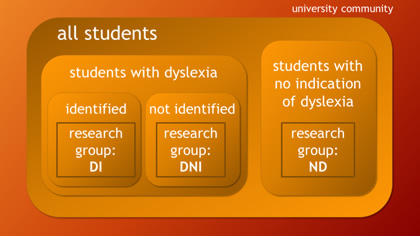 These three research groups are to be referred to as:
- Research group ND: students with no indication of dyslexia;
- Research group DI: students with a dyslexic learning difference that has already been identified;
- Research group DNI: students with a dyslexic learning difference that has NOT previously been identified;
As the datasets arrive following the deployment of the main QNR, the profiles that these generate are available here and each set is available by selecting the research group from the graphic --->>>
The profile visualization sets take a while to load up - please be patient.
183 QNRs have been received (at the date of this page edit (below)) and of these, 17 were considered 'spoiled' due to a substantial element of missing or incomplete data.
68 QNR respondents disclosed a dyslexic learning difference. Of the remaining 98 QNR respondents, 75 indicated that they had 'no learning challenges' and of the 23 that indicated 'learning challenges identified' 17 of these either reported this as 'something else' (selected from the list of recognized learning challenges and disabilities) or didn't disclose their learning challenge. It is taken that these 17 respondents were indicating that they found their learning challenging but did not regard themselves as having a 'learning challenge' per se, at least in the context of the learning challenges and disabilities offered in the list.
From amongst the 98 datasets that comprise research group ND, it has been possible to identify a sizeable group of respondents who are presenting a Dyslexia Index (Dx) of the same order as that for the majority of respondents in research group DI - that is, those who disclose on their QNR response that they have a dyslexic learning difference. Hence research group DNI is developing - that is, respondents who might be presenting a non-identified dyslexic learning difference based on the criteria established for measuring Dyslexia Index in this project. A more detailed report on how the Dyslexia Index has been developed is available here:
What has also emerged is a further interesting research group which comprises QNR respondesnts from both research group DI and research group ND which indicate a Dyslexia Index in the middle range 400 < Dx < 600.
The profiles generated from these respondents are grouped together and are available here:
An ongoing log about how the profiles are created and modified as more datasets arrive is available on the project StudyBlog.
A summary table of results so far is available here:
Discussion
Initial assessments are showing promise that the data collected is rich, valuable and has strong validity. In addition to enabling identification of datasets in research group ND that in fact exhibit profiles more aligned with those from group DI, many questionnaire responses have included rich, qualitative data provided through the free-text writing area in the QNR. A selection of these is presented here: ![]()
What do the profiles mean?
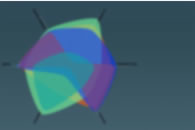
On display are the two, key attributes of Academic Behavioural Confidence (ABC) and Dyslexia Index (Dx), presented as bullet charts, together with radar plots for the profile attribute data that the 6 Likert scales measured in the questionnaire::
- Learning Related Emotions
- Anxiety Regulation & Motivation
- Academic Self-Efficacy
- Self-Esteem
- Learned Helplessness
- Academic Procrastination
The values for each profile attribute fall within the range 0 to 100 as does the value for ABC, whilst the Dyslexia Index is presented as a value between 0 and 1000.
Although deeper analysis is to follow, it is helpful to add meaning to numbers as an introduction:
LRE - Learning Related Emotions
This term is borrowed from research by Putwain et al's paper (2012) which looked at academic self-efficacy in the context of study skills behaviours in university students, setting the framework of the study into relationships with academic success and learning related emotions (LRE). Rooted in seminal research by Bandura in the 1980s which set out the groundwork on self-concept and self-efficacy, LREs draw on Bandura's idea of affective processes, that is, concerns with the effects that emotions and feelings have in regulating learning behaviour, is one of the four, mediating processes.
The 6 items in this section of the QNR were gauging LREs such as embarrassment, guilt, reflection on others' opinions of the respondent in a study context, feelings of difference and so forth.
The section comprised 4 statements pitched in a broadly negative sense - eg: 'I feel guilty about my learning challenges' - with the remaining 2 presenting a more positive focus - eg: 'I don't think about my learning challenges much'.
Given this more negative bias to the section statements, high scores on this scale imply a respondent's more general alignment with the negative attributes being measured. The mean average score for this scale is therefore adjusted so that raw scores for the 4 negatively biased statements are combined with reverse-coded (100-raw) scores for the positively-phrased statements to calculate the mean value.

A high score on the LRE scale would be suggesting that the respondent is embarrassed to ask for help and unlikely to use learning support services due to feelings of 'difference' that outweigh a desire for help; feels guilty about their learning challenges; has a perception that their student-peers think that their difficulties are more likely excuses for laziness or some other generally negative attribute; finds it hard to settle down to their studies when required and often dwells on their own difficulties. In summary, a high score on this scale may be indicating overall feelings of low levels of self-assurance, a generally introspective self-concept that dwells on difficulties and a high level of academic despondency (Rosslyn, 2004).
ARM - Anxiety Regulation and Motivation
Statements on this scale are attempting to gauge the impact of anxiety and anxiety-related emotions as more specific LREs in relation to study efficacy. It is compounded in this section with the idea of motivation because there is a substantial body of literature examining the relationships between anxiety and motivation in learning contexts (eg: Op't Eynde, 2006, Pekrun, 2006) indicating strong linkages.
The section is attributed a positive bias although with an equal balance of negatively and positively biased statements for respondents to gauge, in later analysis, scores for the negatively-biased statements will be reverse-coded.
 A high score on the ARM scale indicates a respondent who is able to concentrate well, who has stable anxiety levels which aren't impacted by learning challenges, who is aware of their learning strengths and uses them positively, who rarely experiences frustration when studying, feels study-confident and well-motivated in the company of their learning peers and may be likely to enjoy studies even more when the work gets more challenging. Generally, a high score is indicating a respondent who is at ease with the challenges of study, is well-motivated and is likely to have an expectation of high achievement.
ASE - Academic Self-Efficacy
A major part of this research project is exploring academic self-efficacy and draws on a wealth of research studies conducted in recent years. Notably, extensive work by Pajares looking at Bandura's legacy to researchers in education in the field of self-efficacy ( Pajares, 1997) together with a later study with Schunk (2001) are examples of the theoretical perspective which underpin this research project.
 All 6 statements on this scale take a positive bias so no reverse-coding of data is necessary.
A high score on the ASE scale indicates respondent who believes that planning and organizing their study processes impacts positively on academic achievement; they recognize their learning strengths and use them to their academic advantage, particularly to help them to be creative; they might pay little regard to the impact of any learning challenges on academic achievement or may consider that they don't have learning challenges (although this wasn't specifically gauged); they approach written work with a high expectation of success; they manage their studies perfectly adequately themselves and rarely request help.
SE - Self-esteem
A substantial body of research exists on the relationship between self-esteem as one of the factors of self-concept and learning, learning performance, learning styles, academic performance, academic achievement and most other attributes that characterize the ways that individuals interact with learning environments. Many researchers exploring the impact of dyslexia on (learning) self-esteem report that dyslexic learners often exhibit lower levels of self-esteem than their non-dyslexic peers although most of the research focuses on school-aged learners. However, as the effects of widening participation initiatives have taken effect on the demography of university learners, many researchers have been re-focusing their interest on dyslexia in university students with the characteristic of self-esteem often featuring strongly in many studies. An early paper by Riddick et al (1999) adopted a largely case study approach to explore self-esteem (and anxiety) in the learning histories of adult dyslexic students but did report that the results of the Culture-free Self-esteem Inventory (Battle, 1992) used with the research group indicated significantly lower self-esteem for the dyslexic group compared with the control group. A much deeper review and analysis of the literature relating to dyslexia, self-esteem and university students will be reported later.
 The 6 items on this scale relate to perceptions of (academic) worth and with 3 statements being presented with a negative sense and the other 3, positive, this scale was ascribed overall a positive bias. So scores for negative-bias statements are reverse-coded using the same, 100 - raw score, approach adopted for other scales when combined with the positive-bias statement scores to calculate the mean score for this scale.
A high score on the SE scale indicates a respondent who has a strongly positive sense of their academic worth, that they regard themselves as good at studying (perhaps even academically talented), that they can achieve just as much as anyone else, they approach written tasks with enthusiasm and don't feel a sense of hopelessness when tackling academic work nor did they feel stupid at school and would disagree strongly with the QNR statement: 'my contributions in class are usually rubbish, so generally I don't bother'.
LH - Learned helplessness
 The concept of Learned Helplessness (LH) was in vogue amongst researchers some time ago (eg: Brown & Inouye, 1978, Abramson et al, 1978) and has been included in later work that has a specific focus on LH in an academic context, more specifically in relation to dyslexia. Humphrey & Mullins (2002) looked at several factors that influenced the ways that dyslexic children perceived themselves as learners identifying learned helplessness as a significant characteristic. Later work by Burden drew on relationships between learned helplessness and academic self-perception incorporating the characteristic in the development of his 'Myself as a Learner' scale (Burden, 2000) which he used with children with dyslexia (Burden, 2005), which has greatly influenced the QNR used in this project, as has Burden's additional evaluatative tool, the 'Dyslexia Identity Scale' discussed in his thesis on dyslexia and self-concept (ibid). The idea of learned helplessness is rooted in the perception of a lack of control of events or circumstances leading to a resigned acceptance of what is expected as inevitable.
Since all 6 items
all phrased negatively, no reverse-coding is necessary and a high score on the LH scale indicates a respondent who feels that they have little active control over their academic academic achievement, are more likely to cite luck rather than any effort on their own part when a good grade is achieved, feel that when starting new topics they will usually be too difficult for them and that however hard they try, their effort makes little difference to the academic results they expect to gain. They also think that they will usually be held back by their learning challenges and that they are generally not surprised when their work attracts low marks.
AP - Academic procrastination
Procrastination has long been recognized as a hindrance to academic achievement although much of the evidence is anecdotal or inconsistent. In their meta-analysis of relevant studies, Kyung and Eun (2015) found that although procrastination appeared to be negatively correlated with academic performance, evaluators and measurements used significantly impacted on the strength of the relationships claimed. Tan et al (2008) looked at academic procrastination and grade goals with results showing that [academic] self-efficacy was negatively correlated to procrastination. Of particular relevance to this project is a study by Klassen et al (2008) which compared levels of procrastination between students with and without learning differences (LD) which indicated that individuals with LD exhibited significantly higher levels of procrastination together with lower levels of self-regulation and self-efficacy than those without any indication of learning differences.

The 6 items on this scale gauge the respondents' levels of academic procrastination broadly in relation to how they respond to academic deadlines for completing assignments and how enthusiastically they approach new tasks. 2 items were phrased in a positive sense with the remaining 4 taking a negative tone so the scale was assigned overall a negative bias with positive-statement scores being reverse-coded as above, (100 - raw score), to produce the recorded value.
A high score on the AP scale indicates a student frequently puts off getting started on assignments, is often working right up to the deadline or has to regularly ask for additional time, generally agrees that the might achieve higher grades if they didn't have to usually rush to finish assignments and often finds other things to do rather than focusing on the demands of their academic studies.