discourse study-blog | resources | lit review maps | profiles
enquiry research QNR / dx factors | dysdefs QNR | dysdims QNR
 Factors
1. Dyslexia Index (Dx) Factors by research subgroup
![]() The data summary tables collected here show a breakdown analysis of the Dyslexia Index Factors for each research subgroup of interest in the project. This analysis was completed in SPSS with the Rotated Component Matrix available here which summarizes the resulting distribution into factors of the scale-item dimensions from the Dyslexia Index section of the main research QNR.
The data summary tables collected here show a breakdown analysis of the Dyslexia Index Factors for each research subgroup of interest in the project. This analysis was completed in SPSS with the Rotated Component Matrix available here which summarizes the resulting distribution into factors of the scale-item dimensions from the Dyslexia Index section of the main research QNR.
The Principal Factor Analysis is reported on the StudyBlog ('Principal Component Analysis') where this first Table 1 (below) is also presented. This table shows the factor-split Dx values for each respondent in the subgroup of particular interest, DNI. This is respondents with no reported dyslexia but who were sifted out from research group ND because their Dx values suggest that they are presenting dyslexia-like profiles. The boundary value used in the sifting process was Dx > 592.5. A report outlining the research decisions that arrived at this value is presented on the StudyBlog.
The other research subgroups contain more datasets (n=47, n=44) than subgroup DNI (n=18) and so where just the summary data is referred to in the blog-post ('Dyslexia Index factor profiles for respondents in the research subgroups'), the complete data tables are presented in full below. Research subgroup DI-600 is respondents with reported dyslexia whose Dyslexia Index takes a value of Dx > 592.5; research subgroup ND-400 is respondents with no reported dyslexia whose Dyslexia Index takes a value of Dx < 400
There is work to do in understanding these data breakdowns but a first inspection reveals some interesting features which are summarised in the blog-post.
A full discussion to attempt to understand the meaning of this data will be presented in the final thesis.
Respondents highlighted in green text.are linked to their additional written commentaries submitted in their completed QNR.
Table 1: Dyslexia Index Factors for research subgroup DNI
![]() Dyslexia Index Factors for research subgroup DNI - summary
Dyslexia Index Factors for research subgroup DNI - summary
open the panel to view the data
| Dx overall | Student respondents | Dx Factor 1 | Dx Factor 2 | Dx Factor 3 | Dx Factor 4 | Dx Factor 5 |
| research group ND subgroup DNI |
Reading, Writing, Spelling | Thinking & Processing | Organization & Time Management | Verbalizing & Scoping | Working Memory | |
| 684.75 | means | 763.01 | 647.60 | 635.53 | 734.64 | 668.82 |
| 76.55 / 18.56 | st dev / st err | 141.87 / 34.41 | 123.49 / 29.95 | 152.28 / 36.93 | 257.97 / 62.57 | 668.82 / 61.58 |
| 648 < μ < 721 | 95% CI for μ | 696 < μ < 830 | 589 < μ < 706 | 563 < μ 708 | 612 < μ < 857 | 548 < μ <790 |
| 597.39 | #75931558 | 916.77 | 432.65 | 489.60 | 634.84 | 609.76 |
| 604.94 | #96408048 | 824.11 | 746.99 | 512.26 | 80.00 | 489.51 |
| 619.58 | #61624105 | 505.49 | 549.41 | 706.84 | 812.97 | 1000.00 |
| 639.45 | #16730769 | 583.02 | 714.22 | 483.05 | 1000.00 | 390.24 |
| 642.01 | #20048355 | 567.20 | 718.86 | 568.08 | 852.27 | 500.00 |
| 642.02 | #57371454 | 635.70 | 546.16 | 753.05 | 976.64 | 648.78 |
| 642.26 | #97653577 | 694.09 | 559.57 | 712.99 | 816.33 | 472.93 |
| 654.84 | #99268333 | 840.57 | 472.01 | 493.79 | 666.09 | 749.02 |
| 655.32 | #63726872 | 570.07 | 771.58 | 500.00 | 466.41 | 800.00 |
| 656.90 | #14557932 | 786.18 | 646.99 | 576.10 | 835.23 | 269.27 |
| 659.87 | #78323952 | 700.81 | 621.80 | 518.70 | 938.91 | 316.10 |
| 682.51 | #18801333 | 851.97 | 604.32 | 445.99 | 549.45 | 753.90 |
| 708.61 | #21388930 | 878.05 | 613.15 | 755.14 | 336.95 | 1000.00 |
| 731.52 | #87083069 | 895.96 | 647.76 | 851.19 | 1000.00 | 339.02 |
| 746.04 | #10498881 | 903.14 | 527.08 | 705.65 | 933.44 | 1000.00 |
| 753.67 | #68379308 | 819.43 | 788.45 | 611.81 | 549.53 | 884.63 |
| 779.07 | #84526262 | 781.43 | 821.46 | 755.25 | 774.53 | 878.29 |
| 909.43 | #28565915 | 980.17 | 874.41 | 1000.00 | 1000.00 | 937.32 |
Table 2: Dyslexia Index Factors for research subgroup DI-600
![]() Dyslexia Index Factors for research subgroup DI-600 - summary
Dyslexia Index Factors for research subgroup DI-600 - summary
open the panel to view the data
| Dx overall | Student respondent | Dx Factor 1 | Dx Factor 2 | Dx Factor 3 | Dx Factor 4 | Dx Factor 5 |
| research group DI subgroup DI-600 |
Reading, Writing, Spelling | Thinking & Processing | Organization & Time Management | Verbalizing & Scoping | Working Memory | |
| 717.32 | means | 794.50 | 700.42 | 615.72 | 772.72 | 589.20 |
| 69.92 / 10.26 | st dev / st err | 106.33 / 15.68 | 131.07 / 19.32 | 145.72 / 21.49 | 165.11 / 24.34 | 227.14 / 33.49 |
| 697 < μ <737 | 95% CI for μ | 764 < μ < 825 | 663 < μ < 738 | 574 < μ < 658 | 725 < μ < 820 | 524 < μ < 655 |
| 592.52 | #32887925 | 756.18 | 332.24 | 458.14 | 794.45 | 725.61 |
| 595.04 | #20726963 | 673.80 | 584.70 | 490.85 | 587.66 | 602.20 |
| 606.82 | #10779962 | 618.41 | 455.34 | 461.30 | 763.28 | 509.76 |
| 616.91 | #44789560 | 675.06 | 549.09 | 841.81 | 777.34 | 0.00 |
| 633.07 | #61502858 | 674.11 | 554.91 | 515.25 | 944.53 | 573.17 |
| 634.44 | #12595865 | 656.63 | 676.74 | 815.65 | 946.56 | 609.76 |
| 638.29 | #95872552 | 500.00 | 500.00 | 500.00 | 500.00 | 500.00 |
| 641.94 | #21789859 | 857.48 | 557.21 | 657.18 | 870.86 | 182.93 |
| 643.33 | #44859855 | 790.31 | 634.68 | 506.78 | 691.09 | 0.00 |
| 653.86 | #75137073 | 841.33 | 726.62 | 558.19 | 777.34 | 243.90 |
| 657.64 | #50744483 | 816.86 | 692.21 | 464.18 | 786.25 | 628.78 |
| 665.17 | #30598961 | 826.60 | 454.34 | 680.79 | 777.34 | 609.76 |
| 668.89 | #69740230 | 685.51 | 703.20 | 829.94 | 500.00 | 665.85 |
| 669.98 | #63170765 | 574.35 | 791.46 | 587.40 | 633.52 | 741.71 |
| 674.51 | #67380181 | 699.88 | 598.26 | 730.96 | 899.92 | 981.71 |
| 679.93 | #11098724 | 811.73 | 754.22 | 520.28 | 643.67 | 654.15 |
| 682.21 | #67632469 | 795.15 | 689.66 | 763.39 | 919.84 | 70.00 |
| 690.70 | #21694901 | 646.56 | 622.95 | 788.70 | 1000.00 | 882.93 |
| 698.65 | #47581572 | 768.38 | 770.75 | 593.84 | 741.72 | 568.54 |
| 699.15 | #74355805 | 935.42 | 796.00 | 473.90 | 679.38 | 531.71 |
| 702.32 | #77173907 | 744.75 | 630.14 | 529.38 | 839.92 | 716.59 |
| 705.82 | #41273845 | 835.32 | 655.16 | 744.63 | 1000.00 | 651.46 |
| 707.66 | #21673654 | 875.96 | 808.45 | 462.60 | 632.11 | 573.90 |
| 716.10 | #16359248 | 703.94 | 698.86 | 1000.00 | 459.92 | 140.24 |
| 719.63 | #17465316 | 752.00 | 647.03 | 635.03 | 764.53 | 516.34 |
| 725.16 | #78372084 | 756.29 | 797.72 | 312.43 | 644.53 | 609.76 |
| 728.64 | #82550367 | 810.45 | 726.03 | 818.93 | 1000.00 | 869.51 |
| 735.19 | #88952978 | 787.27 | 761.30 | 475.82 | 666.41 | 624.88 |
| 739.18 | #56837694 | 839.45 | 778.70 | 588.64 | 510.00 | 556.83 |
| 745.66 | #52594555 | 759.62 | 767.24 | 514.41 | 600.00 | 782.93 |
| 748.93 | #90023507 | 809.69 | 729.06 | 468.64 | 772.11 | 662.20 |
| 751.23 | #87564798 | 840.86 | 850.23 | 712.43 | 510.94 | 648.78 |
| 760.80 | #38307943 | 974.01 | 616.62 | 760.40 | 911.25 | 637.07 |
| 763.09 | #41496790 | 896.91 | 573.86 | 599.32 | 1000.00 | 609.76 |
| 768.97 | #82055919 | 929.07 | 639.82 | 735.59 | 977.73 | 648.78 |
| 773.28 | #22995924 | 784.61 | 871.28 | 474.86 | 973.28 | 644.88 |
| 778.04 | #81973995 | 920.14 | 854.13 | 401.69 | 625.94 | 609.76 |
| 778.33 | #49708220 | 844.13 | 772.37 | 696.21 | 549.69 | 585.37 |
| 778.46 | #60363012 | 810.93 | 841.10 | 471.19 | 777.34 | 390.24 |
| 792.50 | #87579284 | 909.41 | 715.75 | 488.14 | 888.67 | 875.12 |
| 796.62 | #89059542 | 829.93 | 553.17 | 729.77 | 1000.00 | 1000.00 |
| 797.84 | #74428045 | 811.09 | 903.93 | 567.34 | 568.59 | 747.80 |
| 797.98 | #85897154 | 765.46 | 868.15 | 621.36 | 811.02 | 717.07 |
| 803.77 | #77407616 | 975.06 | 817.24 | 667.80 | 777.34 | 420.73 |
| 807.36 | #27618034 | 946.98 | 843.63 | 827.51 | 1000.00 | 604.39 |
| 835.65 | #48997796 | 834.49 | 819.18 | 683.62 | 821.88 | 704.88 |
| 912.71 | #69277072 | 989.74 | 934.93 | 713.73 | 1000.00 | 860.49 |
Table 3: Dyslexia Index Factors for research subgroup ND-400
![]() Dyslexia Index Factors for research subgroup ND-400 - summary
Dyslexia Index Factors for research subgroup ND-400 - summary
open the panel to view the data
| Dx overall | Student respondent | Dx Factor 1 | Dx Factor 2 | Dx Factor 3 | Dx Factor 4 | Dx Factor 5 |
| research group ND subgroup ND-400 |
Reading, Writing, Spelling | Thinking & Processing | Organization & Time Management | Verbalizing & Scoping | Working Memory | |
| 304.00 | means | 276.43 | 214.38 | 586.78 | 458.02 | 377.68 |
| 67.48 / 10.29 | st dev / st err | 118.78 / 18.11 | 103.08 / 15.72 | 151.32 / 23.08 | 218.03 / 33.25 | 206.19 / 31.44 |
| 284 < μ < 324 | 95% CI for μ | 241 < μ < 312 | 184 < μ < 245 | 542 < μ < 632 | 393 < μ < 523 | 316 < μ < 439 |
| 88.42 | #91518540 | 33.25 | 21.92 | 470.40 | 177.50 | 93.66 |
| 147.64 | #76211159 | 181.19 | 9.41 | 629.38 | 199.69 | 0.00 |
| 178.81 | #12161792 | 205.70 | 35.96 | 435.42 | 465.78 | 177.07 |
| 204.02 | #68941653 | 68.46 | 359.54 | 100.68 | 5.55 | 79.27 |
| 222.44 | #36617000 | 199.67 | 182.01 | 490.00 | 339.14 | 182.44 |
| 228.69 | #30986732 | 207.65 | 140.21 | 522.49 | 307.58 | 275.37 |
| 232.27 | #73897011 | 252.59 | 173.63 | 716.50 | 129.14 | 139.02 |
| 252.21 | #34115096 | 296.79 | 38.17 | 466.50 | 57.89 | 506.83 |
| 260.33 | #41501454 | 170.07 | 124.89 | 590.96 | 589.06 | 636.59 |
| 261.48 | #74011406 | 28.27 | 323.81 | 620.73 | 330.78 | 390.24 |
| 274.57 | #24931735 | 326.37 | 123.29 | 823.73 | 222.66 | 403.66 |
| 275.97 | #61231849 | 128.86 | 254.66 | 627.85 | 422.50 | 351.22 |
| 276.18 | #23894998 | 294.30 | 198.97 | 627.01 | 522.97 | 324.39 |
| 278.34 | #21853014 | 126.98 | 141.78 | 569.94 | 1000.00 | 210.73 |
| 281.77 | #89902966 | 227.22 | 366.48 | 507.91 | 530.55 | 110.00 |
| 286.15 | #25893877 | 147.65 | 92.58 | 797.51 | 622.03 | 361.22 |
| 301.01 | #15789237 | 315.46 | 138.49 | 720.73 | 453.44 | 449.51 |
| 302.82 | #30113372 | 80.67 | 278.31 | 583.62 | 642.50 | 440.24 |
| 306.04 | #65118727 | 288.88 | 259.95 | 504.69 | 539.22 | 293.90 |
| 308.84 | #41750383 | 228.60 | 340.37 | 494.24 | 397.58 | 609.76 |
| 319.07 | #43052413 | 226.98 | 150.62 | 440.90 | 797.66 | 643.90 |
| 321.56 | #33549302 | 269.74 | 365.80 | 626.05 | 389.06 | 390.24 |
| 323.37 | #18703444 | 495.68 | 77.05 | 506.72 | 686.72 | 386.34 |
| 326.09 | #94875457 | 380.55 | 132.24 | 499.66 | 666.41 | 526.59 |
| 327.60 | #39284633 | 149.55 | 264.36 | 634.35 | 259.84 | 835.37 |
| 334.95 | #69417357 | 441.69 | 315.07 | 493.22 | 366.41 | 78.05 |
| 335.35 | #21274561 | 239.50 | 259.25 | 542.49 | 645.86 | 317.07 |
| 345.19 | #43811153 | 264.96 | 205.02 | 557.91 | 722.27 | 478.05 |
| 345.22 | #39243302 | 455.11 | 146.58 | 757.06 | 666.41 | 382.93 |
| 345.28 | #79451676 | 450.86 | 146.89 | 462.37 | 477.81 | 628.54 |
| 346.15 | #21294241 | 377.72 | 319.86 | 576.27 | 404.77 | 473.17 |
| 351.79 | #72989831 | 298.57 | 231.74 | 557.63 | 855.78 | 151.22 |
| 363.39 | #51781498 | 320.78 | 143.77 | 541.36 | 445.31 | 841.46 |
| 363.58 | #21591730 | 393.59 | 289.50 | 393.22 | 340.08 | 239.02 |
| 365.29 | #11270227 | 402.23 | 234.57 | 793.33 | 500.00 | 235.12 |
| 368.74 | #96620843 | 367.93 | 223.79 | 817.80 | 504.45 | 684.15 |
| 369.12 | #55702780 | 262.47 | 339.16 | 772.32 | 433.98 | 395.12 |
| 372.13 | #97326352 | 433.42 | 327.10 | 340.11 | 356.48 | 286.59 |
| 375.31 | #81902739 | 346.01 | 324.57 | 770.00 | 285.31 | 470.73 |
| 380.40 | #52641377 | 388.27 | 232.40 | 974.46 | 778.13 | 129.51 |
| 383.65 | #84596013 | 332.90 | 236.30 | 638.14 | 638.67 | 593.90 |
| 386.09 | #46690418 | 412.57 | 210.27 | 665.76 | 500.00 | 695.12 |
| 397.08 | #10697171 | 393.21 | 424.22 | 597.57 | 409.22 | 301.22 |
 2. Academic Behavioural Confidence (ABC) Factors
A similar process of Principal Component Analysis has been executed on the data collected on Academic Behavioural Confidence, also through SPSS.
This has been prompted because a revised, 17-item ABC Scale has been established by Sander & Sanders (2009) following a re-inspection of the combined data from several of their earlier studies where ABC had been measured, and this was developed through PCA on data collected through their original 24-item scale. Their (relatively) large composite dataset (n = 865) was established by bringing together data collected from five earlier studies between 2001 and 2006 with psychology undergraduates (n=507) from one university in South Wales, together with a further dataset of ABC values obtained from first-year medical students at one HE institution in the Midlands collected in 2001 (n = 182) and an additional dataset of health care students from a new university in South Wales attending 6 different courses ranging from podiatry to dental health care (n = 176). The two, smaller of these three datasets are of a similar size to the number of respondents in this current project (n=166). There are both differences and similarities in the cohorts of students in Sander & Sanders' combined dataset when compared with features of my dataset. For example, a differences was that in the Sander & Sanders studies, students were all undergraduates whereas in my study all students in the university community were invited to participate in the research which produced an overall ratio between undergraduates and other students of 75% : 25%. ('undergraduates includes students attending foundation or access courses and 'other students' comprises post-graduates, research students and a very small number of others who did not disclose their study level (3)). However, a similarity was that in Sander & Sanders' datasets, students' previous academic achievement at A-level was recorded as across the complete range of grades and since this data was not requested in my study it is reasonable to assume that students who responded presented an equally wide range of prior academic achievement. In the Sander & Sanders' datasets, students were drawn from a narrow range of subject specialisms whereas in my study, subject studied at university was not recorded so it is also reasonable to assume that students from across the complete curriculum are as likely to have participated as not.
It was felt, therefore, that there are reasonable grounds for conducing PCA on my data because there may be bias in Sander & Sanders' analysis due to students being all undergraduates and all from similar subject specialisms whereas students in my datapool can be assumed to be representative of the complete student community at university as no data was collected in relation to their academic discipline. Hence the specific factor structure that my be revealed from my PCA may be more appropriate to use in my comparative analysis with Dyslexia Index as opposed to relying on the factor structure and revised 17-item ABC scale determined from the Sander & Sanders' collection of studies. Research data collected through the Academic Confidence Scale in an existing study (Corkery, 2011) was conducted to identify factors relevant to that data and these emerged as different from the factor analysis conducted by Sander & Sanders so a precedent is set for this approach to PCA within a research project.
Nevertheless, for this research project, the original 24-item ABC scale has been used in the main research QNR which has proved expedient since both the aggregated ABC-24 and ABC-17 values can be established for all the respondents in the datapool. In addition, data sifted through the Sander & Sanders factor structure can be compared with a similar process with factors established from my own PCA - indeed, a valuable exercise has been to compare which individual scale items map to which factors in each of the PCAs, the result of which is reported on the StudyBlog.
Briefly, the PCA on Academic Behavioural Confidence for this project's data resulted in 5 factors being identified and although the factor structure was not as simple as is desirable because a few dimensions (that is, ABC scale items) mapped to more than one factor, it is felt that in the context of this enquiry, there is justification for accepting the PCA outcomes. A report about this is presented also on the StudyBlog and this will be explored more fully in the final thesis. The 5 factors identified have been categorized as:
- Study Efficacy
- Engagement
- Academic Output
- Attendance
- Debating
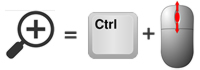
This process, in combination with the PCA on Dyslexia Index has enabled a very interesting matrix of effect sizes and t-test results to be compiled which identifies significant interrelationships between much more than the overall ABC and Dx values of all respondents in the project.
The table below sets out Hedges 'g' effect sizes and Student's t-test p-values for differences in ABC on a Dx factor-by-factor basis. This means that when respondents are sifted into the three respective research subgroups DNI, DI-600 and ND-400 according to each of the Dyslexia Index Factor values, that row of data
presents the effect size differences (and t-test 'p' values) between the research subgroups for each ABC factor. For example, when sifting respondents into subgroups using Dx Factor 2 Processing as the criteria, the ABC Factor 2 Engagement showed an effect size of 0.43, considered as 'medium', between research subgroup DNI and DI-600, together with a very nearly significant difference between the sample means. In other words, students with unreported dyslexia-like profiles presented a measurably higher Engagement factor of Academic Behavioural Confidence than their identified-dyslexic peers.
Hedges 'g' has been used because this calculation uses a weighted mean process for pooling the standard deviations of each dataset being considered which is important when the datasets are of different sizes; Student's t-test for independent sample means is used in the one-tail format because in almost all cases, the mean ABC24 values for research subgroup DNI exceeded those for the (control) research subgroup DI-600.
It is important to understand that the process of sifting respondents' datasets according to Dx Factor results in different research subgroups.
For example: consider responent #96408084 from research group ND (students with no reported dyslexia) who presented an overall Dyslexia Index of Dx = 604.94. This value placed this respondent into the research subgroup of particular interest, DNI, which is students with an unreported dyslexia-like profile. However on a factor by factor basis, this respondent's Dx values are quite disparate ranging from Dx = 824.11 in Factor 1, Reading, Writing, Spelling, to Dx = 80 in Factor 4, Verbalizing and Scoping.
So on the basis of overall Dx value, this respondent is sifted into research subgroup DNI because at Dx = 604.94 this is above the boundary value of Dx > 592.5. However by looking at each of the respondent's Dx Factors. this dataset will only be sifted into research subgroup DNI for Factors 1 and 2, as Dx values for the remaining factors are below the boundary value of Dx = 592.5. Indeed, this respondent would actually feature in research subgroup ND-400 for Dx Factor 4 Verbalizing and Scoping.
| Dx overall | Student respondent | Dx Factor 1 | Dx Factor 2 | Dx Factor 3 | Dx Factor 4 | Dx Factor 5 |
| Reading, Writing, Spelling | Thinking & Processing | Organization & Time Management | Verbalizing & Scoping | Working Memory | ||
| 604.94 | #96408048 | 824.11 | 746.99 | 512.26 | 80.00 | 489.51 |
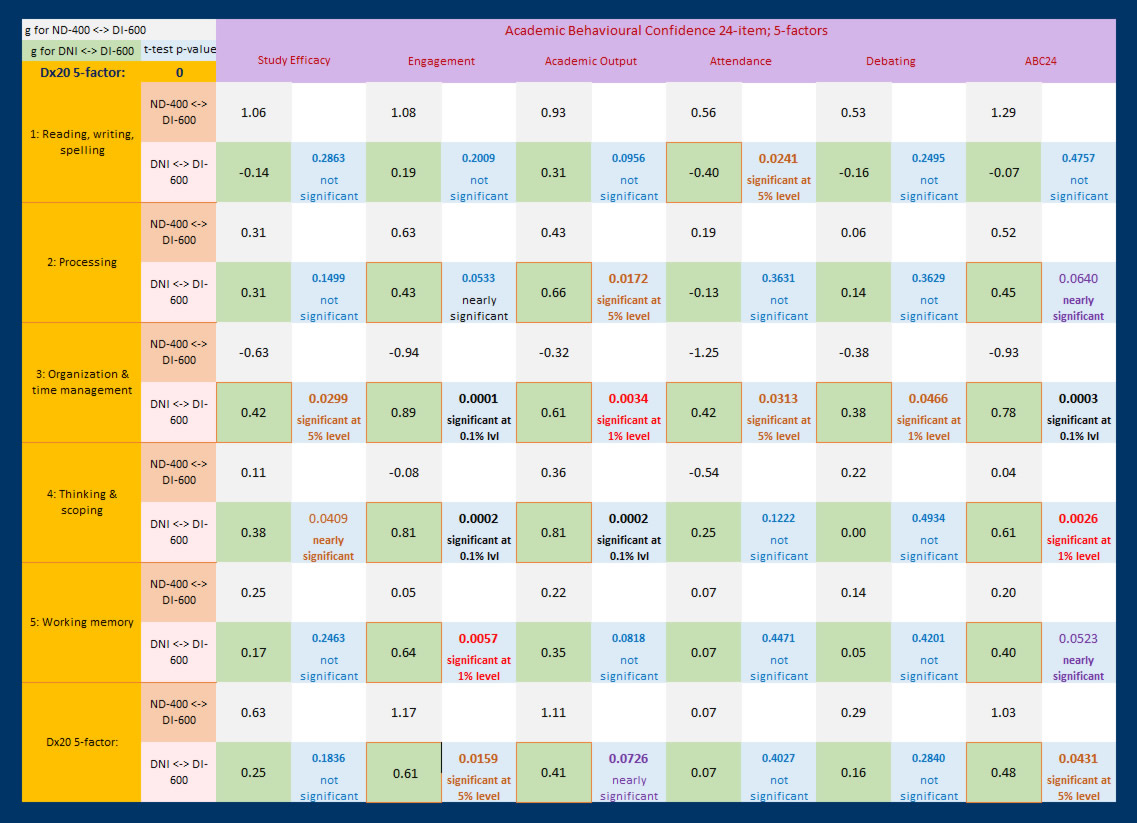
The table below summarises the research subgroup sample sizes and sample Dx means when respondents' datasets are sifted according to this criteria which also shows no significant differences between the Dx factor sample means for research subgroups DNI and DI-600 which supports the appropriateness of comparing other metrics, notably Academic Behavioural Confidence.
Refer to the project StudyBlog for a wider discussion on data summaries presented on this page..