
 The QNR collected data about the prevalence and frequency of attributes, that is, dimensions of dyslexia encountered by dyslexia support professionals in their interactions with students. A link to the QNR was sent by e-mail to all UK Higher Education institutions listed on the Universities UK database. The e-mail was directed to each university's respective student service for students with dyslexia where this could be established from universities' webpages (which was most of them) or otherwise to a more general university enquiries e-mail address. In total, 120 e-mail requests for participation were sent out. 30 replies were received upon which the analysis below if founded.
The QNR listed 18 dimensions and these were established by drawing guidance from two widely used Adult Dyslexia Checklists (Vinegrad, 1994 and British Dyslexia Association, 2002) and adapting these into this QNR where appropriate, based on the researcher's own experience in working with students with dyslexia in HE. The comparison of referral items used in dyslexia screening tests (Rice & Brooks, 2004) has also been consulted and so it was felt that the resulting list of 18 dimensions in this QNR would present a good cross-section of attributes that dyslexia support professionals are likely to encounter in their university contexts. It is acknowledged however, that the list is unlikely to be exhaustive and to this end, a free-writing section was included in the QNR form which invited respondents to list any other attributes that they may have regularly encountered in their interactions with students that were absent from the QNR's list. The results of this are dicussed below the results table.
The analysis and results of this small-scale preliminary enquiry will contribute to the design of the final section of the project's main research QNR.
 A good deal of research from the last two decades that discusses dyslexia in adults appears to rely on the Adult Dyslexia Checklist developed by Vinegrad (1994), although the original source of the research is proving hard to find. All that is known so far is that the checklist was constructed from 679 questionnaire responses from adults in the age range 18 - 68 of which more than half were undergraduate students. The research sample included 32 adults who were known to have dyslexia.
A
similar checklist for adult dyslexia developed and published by the British Dyslexia Association seems to rely on research evidence from Smythe & Everatt (2001) but the research study from which this was developed also seems to be out of the accessible domain. These checklists seem widely used so it is surprising that this is happening almost on trust that the research that underpins them both is robust. At the time of writing, attempts are being made to contact the authors of each checklist to obtain copies of their original research studies. This point is also discussed in the StudyBlog post that reports more fully the results and analysis of this QNR.
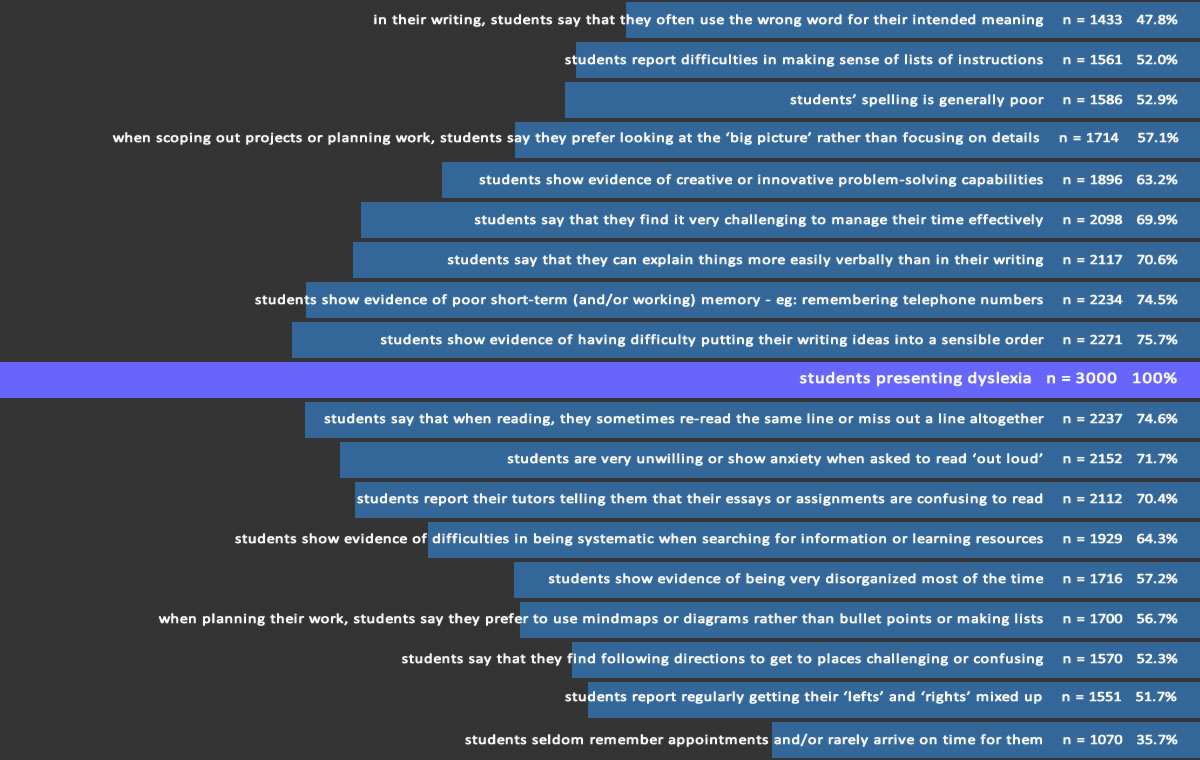
 In the QNR, each stem statement refers to one dimension of dyslexia. 18 dimensions were presented and respondents were requested to judge the frequency that each dimension was encountered in interactions with dyslexic students as a percentage of all interactions with dyslexic students. For example in the stem statement: "students show evidence of being disorganized most of the time" a respondent who judged that they 'see' this dimension in 80% of all their dyslexic student interactions would return '80%' as their response to this stem statement.
The table below presents the complete set of 18 dimensions explored in the QNR. Mouseover each icon to reveal the stem statement that the icon represents. The value in each cell is the Pearson Product-Moment Correlation Coefficient: r, between the respective dimensions' datasets with these values being calculated in an Excel spreadsheet summary of the data, rounded to 3 significant figures. So for example, the value of 0.469 in the first cell is the correlation coefficient between the dimensions "spelling is generally poor" and "shows anxiety when asked to read aloud". (The data is located in a protected folder - request access here).
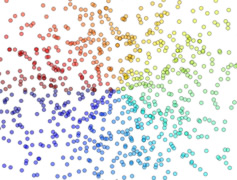 The correlation coefficient displayed in each table cell is also hyperlinked to the respective scatter diagram showing the relationship between the two dimensions graphically. This is useful because it presents the actual data points used in the calculation for the correlation coefficients but the scatter diagram also easily shows whether the datasets contained significant outliers. In all cases, the scatter diagrams were created from the complete datasets without outliers being removed if they occured. In some cases significant outliers did arise and where this occured the outliers were removed to explore the impact that this had on the correlation coeffiecients. Where this was judged to be worth reporting, the adjusted correlation coefficient is included in the lower quadrant of the table with the outlier(s)-removed value asterisked * and the original-data value in parentheses( ). It can be seen that in several cases, removing the outliers has produced a re-calculated correlation coefficient that is substantially different.
The colour coding of the cells in the table provides an 'at a glance' indication of the level of correlation between the respective pairs of dimensions. There appears to be no definitive criteria for setting correlation level boundaries for indications of strength although 'rule of thumb' guidelines suggest that r > 0.6 indicates a 'strong' positive correlation, values between 0.4-ish to 0.6 suggest moderate strength of association and values between 0.3 (or even 0.2 in some sources) and 0.4 indicating weak correlation between the variables. With this in mind, boundaries for the correlation coefficient, r, set for these datasets are more finely defined so that the data table below is easier to understand:
| 0.3 - 0.39... | 0.4 - 0.49... | 0.5 - 0.59... | 0.6 - 0.69... | 0.7 - 1 |