
| w | statement | H / L | r | RC ? |
| 0.80 | When I was learning to read at school, I often felt I was slower than others in my class | H | 0.51 | - |
| 0.53 | My spelling is generally very good | L | - 0.52 | RC |
| 0.70 | I find it very challenging to manage my time efficiently | H | 0.13 | - |
| 0.71 | I can explain things to people much more easily verbally than in my writing | H | 0.60 | - |
| 0.57 | I think I am a highly organized learner | L | - 0.08 | - |
| 0.48 | In my writing I frequently use the wrong word for my intended meaning | H | 0.67 | - |
| 0.36 | I generally remember appointments and arrive on time | L | 0.15 | - |
| 0.75 | When I'm reading, I sometimes read the same line again or miss out a line altogether | H | 0.41 | - |
| 0.76 | I have difficulty putting my writing ideas into a sensible order | H | 0.51 | - |
| 0.80 | In my writing at school, I often mixed up similar letters like 'b' and 'd' or 'p' and 'q' | H | 0.61 | - |
| 0.57 | When I'm planning my work I use diagrams or mindmaps rather than lists or bullet points | neutral | 0.49 | - |
| 0.75 | I'm hopeless at remembering things like telephone numbers | H | 0.41 | - |
| 0.52 | I find following directions to get to places quite straightforward | L | -0.04 | - |
| 0.57 | I prefer looking at the 'big picture' rather than focusing on the details | neutral | 0.21 | - |
| 0.63 | My friends say I often think in unusual or creative ways to solve problems | H | 0.20 | - |
| 0.52 | I find it really challenging to make sense of a list of instructions | H | 0.49 | - |
| 0.52 | I get my 'lefts' and 'rights' easily mixed up | H | 0.39 | - |
| 0.70 | My tutors often tell me that my essays or assignments are confusing to read | H | 0.36 | - |
| 0.64 | I get in a muddle when I'm searching for learning resources or information | H | 0.57 | - |
| 0.72 | I get really anxious if I'm asked to read 'out loud' | H | 0.36 | - |
project outline | design | academic confidence | dyslexia index
discourse study-blog | resources | lit review maps | profiles
enquiry dysdefs QNR | dysdims QNR | research QNR
discourse study-blog | resources | lit review maps | profiles
enquiry dysdefs QNR | dysdims QNR | research QNR
 1st draft (Winter 2017/18)
Academic confidence and dyslexia at university
- ABSTRACT
- ACKNOWLEDGEMENTS
- PROJECT OVERVIEW
- RESEARCH QUESTIONS
- STANCE
- RESEARCH IMPORTANCE
-
 THEORETICAL PERSPECTIVES
-
 DYSLEXIA
- A complex phenomenon or a psuedo-science?
- Dyslexia: the definition issues
- Dyslexia as a multifactoral difference
- Disability, deficity, difficulty, difference or none of these?
- Labels, categories, dilemmas of difference, inclusivity
- Impact of the process of identification
- To Identify or Not To Identify? - that is the question
- Measuring dyslexia - "how dyslexic am I?"
- ACADEMIC CONFIDENCE - theoretical foundations of the construct
- ACADEMIC SELF-EFFICACY
- The construct of academic self-efficacy
- The relationships between academic self-efficacy and academic achievement
- Confidence as a learning attribute
- The location of academic confidence within the construct of academic self-efficacy
- Measuring academic confidence: the Academic Confidence Scale
- Academic Behavoural Confidence
- Historical Development of the ABC Scale
- Recent research using the ABC Scale
- Connecting ABC to academic achievement
- Use of the ABC scale in this research project
-
- RESEARCH DESIGN
- RESULTS and ANALYSIS
- DISCUSSION
- LIMITATIONS
- CONCLUSIONS
- DIRECTIONS FOR FUTURE RESEARCH
- REFERENCES
- APPENDICES
 Abstract
This project is interested in the impact of the dyslexic label on university students' sense of academic confidence.
The premise being tested is that students with an identified dyslexic learning difference present a lower academic confidence than not only their non-dyslexic peers but, more significantly, than their non-identified, apparently dyslexic peers. Confidence in an academic context has been identified as a significant contributor to academic achievement not least due to academic confidence being considered as a sub-construct of academic self-efficacy which has been widely researched. Exploring how academic confidence is affected by learning differences widely attributed to dyslexia is thought to be a fresh approach to exploring how many students tackle their studies at university. The metric used to gauge academic confidence has been the Academic Behavioural Confidence Scale, developed by Sander & Sanders (2006) and which is gaining ground amongst researchers as a useful tool for exploring the impact of study behaviours on academic outcomes.
As for dyslexia, current metrics used for assessing dyslexic learning differences are coarse-graded and tend to focus on diagnosing the syndrome as a disability in learning contexts. The principle objective in identifying dyslexia at university (in the UK) is to provide a means to access learning support funding. Whilst this may have advocates amongst those outwardly pursuing social justice in learning for example, evidence suggests that stigmatization associated with being labelled as 'different' can be academically counterproductive. This project sought to detach dyslexia from the learning disability agenda firstly because there remains a persistently unresolved debate about what dyslexia is, and secondly because the syndrome presents a range of strengths as well as difficulties in relation to learning engagement in literacy-based education systems. To this end, no current dyslexia assessment tools were felt to be appropriate for discriminating those with unidentified dyslexia-like learning profiles from both their dyslexia-identified peers and the wider student population at university. Hence, a fresh, Dyslexia Index Profiler has been developed which attempts to take a more neutral position as a study-preference evaluator that can provide indications of dyslexia-like learning characteristics, as opposed to adopting the difficulty/disability-loaded approach typically seen in other dyslexia assessment tools.
In this survey of 166 university students, the research outcomes indicate that the identification of learners as 'different' may substantially impact on academic confidence and that this may be a more significant factor than that attributed to the impediments and obstacles to effective learning at university that are claimed to be causally connected to the learning differences themselves. Analysis of the data has produced a moderate effect size of g = 0.48 between the Academic Behavioural Confidence of students with identified dyslexia and that of students with apparently unidentified dyslexia-like study profiles. The ABC of the dyslexic subgroup was lower. This result was supported by a statistically significant difference between the mean ABC values of the two groups (t = 1.743, p = 0.043)*.
It is recognized that one limitation of the research has been the untested validity and external reliability of the Dyslexia Index Profiler. However the tool has served its design purpose for this study and this is indicated by good internal consistency reliability shown by a Cronbach's α coefficient of 0.852 (with an upper-tail, 95% confidence limit of α = 0.889)*. It is recommended that further research should be conducted to develop the Profiler, especially as this high value for α may be indicating some scale-item redundancy. Given this further work, a more robust, standardized tool might then be available to contribute to other studies and which might also show promise for a fresh approach to be taken towards identifying dyslexia and dyslexia-like study profiles across university communities where this might be considered appropriate. The Profiler could also become a valuable mechanism for enabling students to more fully understand their learning strengths and difficulties and hence how to integrate these into their study strategies to enhance their opportunities of realistally achieving the academic outcomes that they are expecting from their time at university.
The research is important because to date, no existing, peer-reviewed studies specifically investigating the relationships between academic confidence and dyslexia have been found. It is also important because the research outcomes may contribute to the debate about whether identifying so-called dyslexia amongst university-level learners makes a positive contribution to their ultimate academic outcomes or that the benefits apparently attributed to being labelled as dyslexic are outweighed by the stigma persistently associated with disability and difference, not only in learning environments but in society more generally.
[*to be checked again and verified before final submission}
[words this section: 714 / aggregated word count: 63,074 = 78% written (at 08 Jan 2018) ]
![]()
 Acknowledgements
The researcher acknowledges with thanks, the study support and academic guidance provided by the research community at Middlesex University, the Research Degrees Administration Team at the Department of Education and in particular, the advice and interest of the supervisory team of Dr Victoria de Rijke and Dr Nicola Brunswick.
The researcher also expresses graditude to Middlesex University for the 3-year Research Studentship funding, without which, this research project would not have been possible
[74 / 63,074 (at 08 Jan 2018)]![]()
 Overview
Dyslexia and Academic Confidence at University
Dyslexia is identified in many students as a learning difference but the syndrome remains widely debated (eg: Elliott & Grigorenko, 2014). Nonetheless, the impacts of dyslexia and dyslexia-like profiles on learning are readily apparent in literacy-based education systems ranging from initial identification in early-age learners who experience challenges in the acquisition of reading skills, to university students who attribute many of their struggles to adapt to the independent and self-managed learning processes that are core competencies in higher education learning to a dyslexia or dyslexia-like learning profile.
To gain a greater understanding of the issues is at least a first step towards meeting the learning needs of learning differences (Mortimore & Crozier, 2006), although encouraging the design and development of more accessible curricula - particularly in Higher Education - seems preferable to retrofitting the curriculum to the learner (Lancaster, 2008) by way of 'reasonable adjustments'. This might then mean that learners with dyslexia would feel more included and less 'different' (eg: Dykes, 2008, Thompson et al, 2015) or even that identifying their study profiles as falling within the dyslexia envelope is unnecessary, could be counterproductive in relation to positively advancing their academic achievement and may now be best considered as an alternative form of information processing (Tamboer et al, 2014) in teaching and learning environments that are sufficiently adaptable and flexible to accommodate difference without differentiation. When learning differences cease to impact on access to, and engagement with learning - in whatever ways this is ameliorated - it is reasonable to suppose that the persistent disability model of dyslexia, tacitly implied by 'diagnosis', 'reasonable adjustment' and 'support', will have reduced meaning. Instead, the positive strengths and qualities that form part of the dyslexia spectrum of apparent differences can be celebrated and integrated into the development of the learner in ways that will encourage a greater sense of academic agency to emerge, possibly reflected by stronger academic confidence which may contribute positively towards better and more successful academic outcomes at university (Nicholson et al, 2013).
This project is interested in learning more about how students with dyslexia or dyslexia-like profiles integrate their learning differences into their study-self-identity. It has explored their judgements of its impact on their study processes in relation to their sense of academic purpose, in particular the confidence expressed in meeting the academic challenges they face at university. A fresh, innovative profiler has been developed which attempts to offer an alternative understanding of learning difference which does not focus on deficit-discrepancy models and on disability. The research takes the standpoint that it may be students' awareness of their dyslexia and what the dyslexic label means to them that is the most significant factor impacting on their academic confidence when compared with the challenges that the dyslexia itself may present to their learning engagement. This is thought to be an innovative approach to dyslexia research and aims to challenge the persistent medical, deficit model of dyslexia and the labelling of the syndrome as a disability in Higher Education learning contexts where the prinicple aim is to enable access to differentiated learning support. The research is also expected to contribute to the discourse on the non- or late-reporting of dyslexia in university students (eg: Henderson, 2015), and also add to the limited range of research relating to the academic confidence of university students who are from minority groups, especially those deemed to have a learning disability in whatever ways this might be defined.
Hence the aim of this research project is to explore the relationship between the learning difference of dyslexia and specific aspects of academic agency at university. Zimmerman (1995) spoke of academic agency as 'a sense of [academic] purpose, this being a product of self-efficacy and academic confidence that is then the major influence on academic accomplishment' and it is through the principal concepts of academic self-efficacy and particularly academic confidence that this research project has been tackled. Exploring these relationships and how they are impacted upon by the learning difference of dyslexia is important because relationships revealed may contribute to the emerging discussion on the design of learning development and 'support' for groups of learners who feel marginalized or disenfranchised because conventional learning curriculum delivery tends to be out of alignment with their learning strengths, or due to their perceived stigma about being labelled as 'disabled' in a learning context. This project is particularly topical at this time in the light of plans for dyslexia to be disassociated from the (UK) Disabled Students' Allowance in the near future. Hence the research may contribute to an expected raised level of discourse about creating more inclusive curricula that supports a social justice agenda by arguing for a wider provision of undifferentiated learning development that is fully accessible and actively promoted to the complete, coherently integrated student community in HE and which moves away from the negatively-connatated perception of learning support as a remedial service both amongst academics and students at university (Laurs, 2010).
The key research focus has tested the hypothesis that, for a significant proportion of students with dyslexia, it is their awareness and feelings about how their dyslexia affects their studies at university that has a more significant impact on their academic confidence in relation to the learning differences that the apparent dyslexic condition itself may present. This is important to explore not only because attributes of academic agency and in particular, academic confidence, are increasingly widely reported as markers of future academic achievement but also because it further raises the issue of how to tackle the 'dilemma of difference' (Norwich 2010), originally identified as a significant factor in education by Minow (1985, 1990). This is especially pertinent as dyslexia has been shown to be negatively correlated with both academic confidence and academic achievement (eg: Barrett, 2005, Asquith, 2008, Sanders et al, 2009) indicating that significant interrelationships may be present.
[more content in preparation as required?]
[938 / 63,074 (at 08 Jan 2018)]
![]()
 Research Questions
- Do university students who know about their dyslexia present a significantly lower academic confidence than their non-dyslexic peers?
If so, can particular factors in their dyslexia be identified as those most likely to account for the differences in academic confidence and are these factors absent or less-significantly impacting in non-dyslexic students?
- Do university students with no formally identified dyslexia but who show evidence of a dyslexia-like learning and study profile present a significantly higher academic confidence than their dyslexia-identified peers?
If so, are the factors identified above in the profiles of dyslexic students absent or less-significantly impacting in students with dyslexia-like profiles?
Is there a significant difference in academic confidence between non-dyslexic students and students with non-identified dyslexia-like profiles?
How can these results be explained?
[280 / 63,074 (at 08 Jan 2018)]![]()
 Ethics and Permissions
This research study has been conducted in accordance with all the specified and regulatory protocols set out in the University Regulations of Middlesex University, London.
Following an application to the Ethics Subcommittee of the School of Health and Education, approval to pursue the research and report the results in the form of a thesis to be submitted to the university for consideration for the award of Doctor of Philosophy was obtained on 21st July 2015.
Informed consent was obtained from all research participants, whose confidentiaility and anonymity was protected, who were not harmed by and who participated voluntarily in this study, and were given the opportunity to withdraw the data they had provided from the research at any time.
This research study is independent and impartial, has not been influenced by any external source or agency and has been conducted in accordance with guidance provided in the ESRC Framework for Research Ethics (2015).
The researcher confirms that the research has been conducted with integrity and to ensure quality to the best of his ability and is entirely his own work.
[183 /63,074 (at 08 Jan 2018)]
![]()
 Stance
In the domain of university education, my view, which is broadly based on over a decade's experience of trying hard to be a good academic guide, is that there is a burgeoning need to influence a change in the system of delivery - and most definitely assessment - of learning in Higher Education. As universities open their doors to a much broader spectrum of students through widening participation and alternative access schemes, I believe that many of these new faces, together with the more traditionally-seen ones, would benefit academically were there a better institutional-level understanding of the impact that individual differences have on educational engagement, ownership of learning (Conley & French, 2014) and hence, likely attainment.
The learning environments and processes that are generally prevalent at university are not informed by psychological knowledge and appear to be increasingly driven by the ‘student experience’ of university with the annual National Student Survey having a strong influence on what this is, as students are increasingly considered as consumers (Woodall et al, 2014). In the earlier period following its introduction in 2005, high ratings in the NSS had significant implications for funding, although the direct impact of the NSS on university budgets is now (2017) less significant because universities' income streams are largely from student fees. So whilst the direct financial influence of the NSS is reduced, this has been displaced by shift in emphasis towards how the outcomes of the survey bolster the reputations of universities, especially as viewed by the parents of the largest group of university 'customers', that is 18-24-year-olds. Through my experience in higher education during this last decade or so I have witnessed educational models based on communities of knowledge being displaced by ones that are more focused on the more attractive, social experiences of being at university. This may be more apparent in institutions that are less driven by research funding because these universities have to rely more unidimensionally on income sources generated from student fees to meet their costs: hence, more students equals greater income. Having worked in both WP (Widening Participation) and Russell Group universities, and networked with academic and learning development colleagues across the sector, this is my observation and although I concede that the underlying intention of the NSS is to positively influence teaching and learning quality and to make universities more accountable, the extent to which responding to 'the student voice' achieves this is the subject of continued research (eg: Brown et al, 2014) not least due to wide variations in how raw score data is interpreted (Lenton, 2015).
However, the 'knowledge model' is not without its failings either: arguably entrapped by a rigid pedagogy that in many cases remains rooted to a well-established didactic approach for transmitting knowledge, this kind of university learning can appear to be underpinned by the idea that it is sufficient to inculcate knowledge through a kind of passive, osmotic cognitive process. Notions of ‘student-centeredness’ and inclusivity are less important in this ancient, traditional and frankly elitist approach to imbibing knowledge than is a desire to maintain kudos and reputation. A case in point is the situation that my nephew found himself in throughout the first year of his study at a highly respected London university. It is accepted that making a transition from directed study at A-level to self-managed learning at university can be challenging but even as a top-grade A-level student who was nevertheless expecting his course to be difficult, so far, his 'university experience' has been an unhappy one. He feels that his earlier academic confidence has been substantially eroded because he has yet to find a route to the learning development and support from his academic tutors that he was expecting to be available and which he feels he needs if he is to make progress on his course. He has found the learning environment to be stale, unwelcoming, uncommunicative and isolationistic. He tells me that he considered giving up and leaving his course many times throughout the opening months and greatly regrets his choice of course and university despite these being, on paper at least, a good match for his academic interests and career aspirations. Although his may be an isolated case reported anecdotally, it may also be an indication of a wider malaise and reticence to engage more equitably with the contemporary university student who is choosing to invest in higher education. This seems inappropriate and unnecessarily challenging and if universities are to be part of an academically rigorous, tertiary education system that anyone with the right academic credentials can attend but which includes aspirations towards genuinely fostering social mobility, engendering social justice and meeting the learning development needs of its 'customers', then together with the maintenance of strong academic standards, a renewed effort should be devoted to finding ways to create a middle ground between possibly comptemptible student recruitement incentivization and an outdated, traditional, self-preserving learning orthodoxy. There must be an intermediate position that is properly developed, truly focuses on student-learning-centredness and provides a genuinely inclusive curriculum that everyone is able to engage with so that they are actively encouraged to aspire to their academic potential through the quality of their learning experience at university. Pockets of excellence do exist and these should be brought into the educational limelight with all haste as exemplars.
 Learning diversity
When challenged, or even driven by new legislation The Academy tackles issues of learning inclusivity through the minimal requirements to ensure compliance with 'reasonable adjustment' directives originally established in disability equality legislation now decades old. Adopting a ground-up reframing of academic curricula in ways that by design, embrace learning diversity appears to be outside the scope of strategic planning for the future of tertiary-level, high-quality learning - no doubt because it is considered radical, difficult and far too expensive. Despite this, some pockets of excellence really make a difference to some, if not all learners, demonstrated by those enlightened providers who look towards the adoption of elements of 'universal design' in the construction of university courses in which embracing learning diversities is at the core of curriculum processes (Passmann & Green, 2009). These are learning environments which place at the heart of their curricula the principle of giving all individuals equal opportunity to learn, the creation of learning goals, methods, materials and assessments that work for everyone and dispense with a 'one-size-fits-all' learning-and-teaching agenda in favour of flexible approaches that can be adapted and adjusted for individual needs (Jorgenson et al, 2013). However, attempts to create socially inclusive learning environments and opportunities tend to be inhibited by organizational factors (Simons et al, 2007) which can lead to a tokenist ‘nod’ being the more likely response to advocacy for genuinely making things (i.e. ‘learning’ in its broadest context) better for all participants in the knowledge community of university. More recently this position has been aggravated by an increased focus on accountability and quality of teaching at universities that has particularly created a tension in research-intensive institutions, especially where well-meaning campaigns for a reconfigured and more inclusive perception of 'scholarship' is nonetheless driving a wedge between teaching activities and research ones by lowering the status of teaching (MacFarlane, 2011). This is despite more recent research activities which have been concerned with identifying 'good teaching', quantifying what this means and presenting evidence that this is at the heart of high quality student learning (Trigwell, 2010).
The positive contributions to properly engaging with learning diversity in our universities that these initiatives are making seems patchy at best. In the face of sector-wide challenges ranging from widening participation to developing business-focused strategies that can respond to the government-imposed marketization of higher education (and the funding challenges that this is bringing), tackling the institutional entrenchment of traditional teaching and learning processes with a view to making the learning experience better for everyone and simultaneously striking a good balance between these activities and the essential job of universities to foster climates of research innovation and academic excellence, may be slipping further down the ‘to do’ list, not least because funding is uncertain and other initiatives aimed at providing alternatives to university are on the increase. Witness the diversity of current routes into teaching, most of which are eroding the essential value of academically-based initial training by attempting to develop rapid responses to a recruitment crisi,s that are at best, inappropriately thought through. Never are all these uncertainties more sorely felt than amongst communities of learners who come to university with spectra of learning profiles and preferences that are outside the box and as a result, often feel disenfranchised and not properly accommodated. For these individuals and groups whose learning needs fall outside the conventional envelope, broadly met by the existing ‘one-size-fits-all’ provision of higher education, the current processes of compensatory adjustments tend to apply strategies targeted at ‘fixing’ these unconventional learners – well-meaning as these may be – rather than focusing on the shortcomings of an outdated ‘system’ which originally evolved to serve the academic elite. These students are often labelled with difficult-to-define ‘learning disabilities’ and whatever these so-called ‘disabilities’ are, they are dynamic in nature, not necessarily an objective fact and that it is learning institutions that translate broad profiles of learning strengths and weaknesses into difficulties and disabilities through the strongly literacy-based medium of transmission of knowledge (Channock, 2007) and the lack of adaptability of this to learning differences.
 The stance of this PhD project strongly advocates the belief that an overhaul of the processes for communicating knowledge through current, traditional curriculum delivery is well overdue, and also calls for a paradigm shift in the conventional assessment procedures that learners are required to engage with in order to express their ideas, demonstrate their intellectual competencies and foster the development of innovative thinking. With the focus of this research being ‘dyslexia’ – whatever this is, and which at the moment (Autumn 2017) remains labelled as a learning disability at university, I find myself uncomfortable with the disability label that is attached to the broad profile of learning differences and preferences apparently identifiable as a dyslexia, which is at variance with my strongly held views about embracing learning diversity. Whether someone has dyslexia or not wouldn’t matter – indeed, categorizing a particular set of learning profiles as a dyslexia would be inappropriate, unhelpful and unnecessary not least because in my ideal university, teaching, learning, assessment and access to resources would be offered in an equal variety of ways to match the learning diversities of those who choose to consume and contribute to knowledge environment at university. Everyone would feel included and properly accommodated.
The aim is that by exploring the relationship between the learning disability/difference of dyslexia and academic confidence the research objective is to establish that attributing a dyslexic label to a particular set of learning and study profiles can inhibit academic confidence and hence for the owner of this profile of attributes, contribute to a reduced likelihood of gaining strong academic outcomes. Academic confidence, through being a sub-construct of academic self-efficacy, is widely reported as a potential marker for academic performance (Honicke & Broadbent, 2016) and has been quantified in this project by using an existing measure of Academic Behavioural Confidence (Sander & Sanders, 2006) .
In short, when it comes to guiding learners towards getting a good degree at university, this project is testing the idea about whether is it better to label a so-called dyslexic person as ‘dyslexic’ or not.
If not, then in the first instance this would seem to indicate that dyslexic students, such as they are questionably defined, may be best left in blissful ignorance of their so-called ‘learning difference’ because if they are to have better prospects of gaining a higher academic outcome to their studies that is comparable to their non-dyslexic peers, they should be encouraged to battle on as best they can within the literacy-based system of curriculum delivery that they are studying in, despite it not being suited to their learning profiles, strengths and preferences. Hence there would be no recourse to ‘reasonable adjustments’ that identify them as ‘different’ because the identification itself might be more damaging to their academic prospects than the challenges they face that are considered attributable to their dyslexia. Secondly, this research outcome will add weight to my fundamental argument advocating a shift in ‘the system’ to one which embraces a much broader range of curriculum delivery and assessment as the most equitable means for establishing a level playing field upon which all students are able to optimize their academic functioning.
[1856 / 63,074 (at 08 Jan 2018)]
![]()
 Research Importance
This study is important because it makes a major contribution towards filling a gap in research about dyslexia and academic confidence in the broader educational context of academic confidence as a sub-construct of academic self-efficacy and dyslexia as a learning difference in literacy-based education systems. Aside from two unpublished dissertations (Asquith, 2008, Barrett, 2005), no peer-reviewed studies have been found which specifically explore the impact that dyslexia may have on the academic confidence of learners in higher education. Asquith's study built on the earlier work by Barrett by investigating correlations between dyslexia and academic confidence using Sander & Sanders' (2006) Academic Behavioural Confidence Scale as an assessment tool for exploring academic confidence and Vinegrad's (1994) scale to gauge dyslexia. This study appears to be the only direct precursor of this current PhD project as it also sought to compare three undergraduate student groups: those with identified dyslexia, those with no indications of dyslexia and those who were possibly dyslexic. However this PhD project is the first to develop a fresh measure for identifying dyslexia-like study profiles that is not grounded in the deficit-model of dyslexia.
[187 /63,074 (at 08 Jan 2018)]
![]()
Theoretical Perspectives
 1. Dyslexia
A complex phenomenon or a psuedo-science?
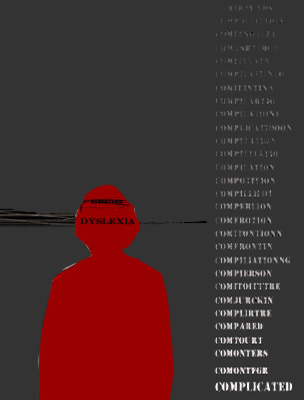
Dyslexia - whatever it is - is complicated.
There is a persistent range of research methodologies and a compounding variety of interpretations that seek to explain dyslexia which continue to be problematic (Rice & Brooks, 2004). Attempts to theorize developmental dyslexia and its aetiology differ quite widely (Peterson & Pennington, 2015) not least when attempting to interpret the variety of characteristics that can be presented (Ramus, 2004). This is especially so in relation to how cognitive differences, more usually regarded as deficits, are classified as dysfunctions (Buttner & Hasselhorn, 2011) and whether these differences are causal, consequential or even covariants of the so-called learning disability (Vellutino et al, 2004). Hence, attributing any accurate, shared meaning to the dyslexic label that is helpful rather than confusing remains challenging at best. This is consistent with well over a century of research, postulation, commentary and narrative which has consistently failed to arrive at an end-point definition that can be ascribed to the dyslexia label (Smythe, 2011), and as long as learning outcomes based on high levels of literacy remain connected to intellect (MacDonald, 2009), learning barriers attributable to even a more positively-focused social construction of dyslexia are likely to remain, no matter how the syndrome is defined (Cameron & Billington, 2015).
Stanovich in particular has repeatedly questioned the discrepancy approach persistently used to measure dyslexia, insisting that when aptitude-achievement is used as the benchmark comparator, such a 'diagnosis' fails to properly discriminate between attributing poor reading abilities to dyslexia or to other typical causes (1988, 1991, 1993, 1996, 1999, 2000). Elliott & Grigorenko (2014) take this further in their argument that identifying dyslexia is problematic to the extent that assessments of it may be so flawed as to be irrelevant or at best, academically counter-productive. Notably, it has also been shown that students with so-called dyslexia in higher education may not be a homogeneous group due to the liklihood that several subtypes of dyslexia or dyslexia-like profiles may exist and hence that any identification approaches adopted, need to be designed to respond accordingly (Tops et al, 2012). These issues are explored below where the discussion specifically expands on the problems and suggested solutions surrounding the determination of the extent of a dyslexic individual's dyslexia - that is, how to assess the severity of dyslexia, or to more properly resonate with the stance of this project, to find out more about the levels of incidence of dyslexia-like characteristics in learning and study profiles and to understand how useful it may be to determine these in academic contexts.
Hence, given the persistent debate surrounding the nature of dyslexia and which aspects of the syndrome might be measurable and for what purpose, assigning a metric to establish a worthwhile appraisal of dyslexia, dyslexia-like characteristics or dyslexia-implied study profiles in learning context is ambitious. It is Stanovich's view that domain-specific difficulties - for example, finding reading challenging, struggling with arithmetic - may be comorbid in many cases, but it is only helpful to group such difficulties under an umbrella term - such as 'learning disabilty' (dyslexia in American) - after an initial domain-specific classification has been established (Stanovich, 1999, p350). This is significant not least because this argument adds weight to the adoption of a factorial view of dyslexia, especially in academically capable adult dyslexics where many of the early-years' learning difficulties may have been displaced by strategically developed learning solutions, leaving other dyslexia 'factors' as more influential in study processes at university. In the domain of adult learning at higher intellectually functional levels, that is in higher education, early-learning academic challenges are more often subsumed by later-learning organizational struggles that impact more substantially on learning confidence in comparison with earlier learning difficulties where processes are developed to circumvent earlier learning weaknesses often through widespread use of study aids (Kirby et al, 2008) and support agencies or technology (Olofsson et al, 2102).
It is significant therefore that relatively recent research interest is attempting to more fully understand subtypes of dyslexia. This builds on an idea first suggested by Castles and Coltheart (1993) who observed that there appeared to be evidence in developmental dyslexia of the subtypes more normally associated with acquired dyslexia - that is, through brain trauma. This suggests that there may be distinct dyslexia factors which may be more or less prevalent in any single individual who presents dyslexia or a dyslexia-like study and learning profile. More recent work has taken dyslexia in adults as a focus and particularly, students in higher education settings. Centred in The Netherlands, recent studies by Tamboer and colleagues in particular (eg: Tamboer et al, 2014) are taking the discussion in a new direction by building on the earlier research of Pennington (2006) and subsequently Le Jan et al (2009) by exploring more fully the factor structure of dyslexia to try to determine firstly whether understanding more about the subtypes of dyslexia can enable more effective screening tools to be developed for use in identifying the syndrome amongst university students, and secondly whether these are distinguishing features of dyslexic learners alone or that they can be observed to varying degrees in other, even all students. This approach in attempting to understand dyslexia and how it might be identified more specifically in tertiary education settings is particularly pertinent to my study and is considered in more detail below. First, an outline of the most significant endeavours to explain dyslexia are summarized.
![]()
Dyslexia: the definition issues
Frith (1999) tried to get to the nub of the definition problem by exploring three levels of description - behavioural, cognitive and biological - but still defined dyslexia as a neuro-biological disorder, speaking of controversial hypothetical deficits, and how these impact on the clinical presentation of dyslexia. The point here is that despite a courageous attempt to clearly provide a targeted explanation through an insightful analysis of the multifactoral impact of her three levels, this seminal paper still broadly concluded that 'undiagnosable' cultural and social factors together with (at the time) uncomprehended genetically-derived 'brain differences' persist in obfuscating a definitive conclusion. In his paper, Ramus (2004) took Frith's framework further, firstly by drawing our attention to the diversity of 'symptoms' (the preference in my paper here is to refer to a diversity of dimensions rather than 'symptoms' - more of this below) and subsequently confirming through his study that neurobiological differences are indeed at the root of phonological processing issues which is a characteristic that is often an early indication of a dyslexic learning difference, regularly observed. But more so, his study shed early light on these variances as an explanation for the apparent comorbidity of dyslexia with other neurodevelopmental disorders, often presented as sensory difficulties in many domains, for example, visual, motor control and balance, and others, which adds to the challenges in pinning dyslexia down. Although Ramus does not propose a single, new neurobiological model for dyslexia, more so suggests a blending of the existing phonological and magno-cellular theories (see below) into something altogether more cohesive, the claim is that evidence presented is consistent with results from research studies in both camps to date, and so is quite weighty. Fletcher (2009), in trying to bring together a summary of more recent scientific understanding of dyslexia, attempts to visualize the competing/contributory factors that can constitute a dyslexic profile in a summary diagram which is helpful.
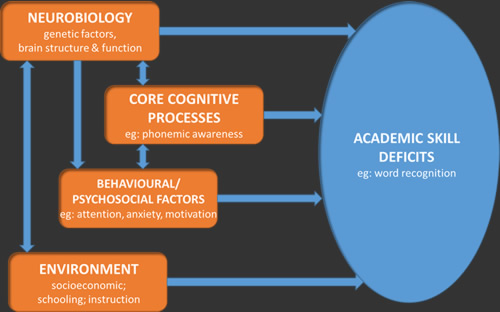
[adapted from Fletcher, 2009, p511]
Fletcher adds a dimension to those previously identified by Frith, Ramus, et al by factoring in environmental influences, not least of which includes social aspects of learning environments which may be some of the most impacting factors on learning identity. Mortimore & Crozier (2006) demonstrated that acceptance of dyslexia as part of their learning identity was often something that students new to university were unwilling to embrace, often because they felt that the 'fresh start' of a tertiary educational opportunity would enable them to adopt other, more acceptable social-learning identities that were deemed more inviting. This conclusion is supported by one respondent in the current research project who reflected on their dyslexia hence:
- "I don't really like feeling different because people start treating you differently. If they know you have dyslexia, they normally don't want to work with you because of this ... I am surprised I got into university and I am where I am ... and I find it very hard [so] I don't speak in class in case I get [questions] wrong and people laugh" (respondent #85897154, available at: http://www.ad1281.uk/phdQNRstudentsay.html )
This illuminates aspects of dyslexia which impact on the identity of the individual in ways that mark them as different -in learning contexts at least - and is an important element that will be discussed below.
Other explanations rooted in physiology, notably genetics, have encouraged some further interest, notably a paper by Galaburda et al (2006) who claimed to have identified four genes linked to developmental dyslexia following research with rodents, and a more recent study which was concerned with identifying 'risk genes' in genetic architecture (Carion-Castillo et al, 2013). However, scientific as these studies may have been, their conclusions serve as much to prolong the controversy about how to define dyslexia rather than clarify what dyslexia is because these studies add yet another dimension to the dyslexia debate.
 Sensory differences is an explanation that has attracted support from time to time and attributes the manifestations of dyslexia most especially to visual differences - the magnocellular approach to defining dyslexia (Evans, 2003 amongst many others). Whilst there is no doubt that for many, visual stress can impair access to print, this scotopic sensitivity, more specifically referred to as Meares-Irlen Syndrome (MIS), may be a good example of a distinct but co-morbid condition that sometimes occurs alongside dyslexia rather than is an indicator of dyslexia. Later research by Evans & Kriss (2005) accepted this comorbidity idea and found that there was only a slightly higher prevalence of MIS in the individuals with dyslexia in their study in comparison to their control. Common in educational contexts to ameliorate vision differences, especially in universities, there is a long-standing recommendation for tinted colour overlays to be placed on hard-copy text documents, or assistive technologies that create a similar effect for electronic presentation of text. But evidence that this solution for remediating visual stress is more useful for those with dyslexia than for everyone else is sparse or contrary (eg: Henderson et al, 2013) or as one study found, can actually be detrimental to reading fluency, particularly in adults (Denton & Meindl, 2016). So although the relationship between dyslexia and visual stress remains unclear, there is evidence to indicate that there is an interaction between the two conditions which may have an impact on the remediation of either (Singleton &Trotter, 2005).
An alternative viewpoint about the nature of dyslexia is represented by a significant body of researchers who take a strong position based on the notion of 'neuro-diversity'. The BRIAN.HE project (2005), now being revised but with many web resources still active and available, hailed learning differences as a natural consequence of human diversity. Pollak's considerable contribution to this thesis about dyslexia, both through the establishment of BRIAN.HE and notably drawn together in a collection of significant papers (Pollak, 2009), expounds the idea that dyslexia is amongst so-called 'conditions' on a spectrum of neuro-diversity which includes, for example, ADHD and Asperger's Syndrome. Particularly this view supports the argument that individuals with atypical brain 'wiring' are merely at a different place on this spectrum in relation to those others who are supposedly more 'neurotypical'. The greater point here is elegantly put by Cooper (2006), drawing on the social-interactive model of Herrington & Hunter-Carch (2001), and this is the idea that we are all neurodiverse and that it remains society's intolerance to differences that conceptualizes 'neurotypical' as in the majority. This may be particularly apparent in learning contexts where delivering the curriculum through a largely inflexible literacy-based system discriminates against particular presentations of neurodiversity (eg: Cooper, 2009).
So defining dyslexia as a starting point for an investigation is challenging. This causes problems for the researcher because the focus of the study ought to be supported by a common understanding about what dyslexia means because without this, it might be argued that the research outcomes are relational and definition-dependent rather than absolute. However, given the continued controversy about the nature of dyslexia, it is necessary to work within this relatively irresolute framework and nevertheless locate the research and the results and conclusions of the research accordingly.
What seems clear and does seem to meet with general agreement, is that at school-age level, difficulties experienced in phonological processing and the 'normal' development of word recognition automaticity appear to be the root causes of the slow uptake of reading skills and associated challenges with spelling. Whether this is caused by a dyslexia of some description or is simply unexplained poor reading may be difficult to determine. Setting all other variables aside, a skilful teacher or parent will notice that some children find learning to read particularly challenging and this will flag up the possibility that these learners are experiencing a dyslexia.
What also seems clear, is that for learners of above average academic ability but who indicate dyslexia-associated learning challenges - in whatever way both of these attributes are measured - it is reasonable to expect these learners to strive to extend their education to post-secondary levels along with everyone else in their academic peer groups, despite the learning challenges that they face as a result of their learning differences. Amongst many other reasons which include desire for improved economic opportunities resulting from success at university, one significant attraction of higher education is a desire to prove self-worth (Madriaga, 2009). An analysis of HESA data bears out the recent surge in participation rates amongst traditionally under-represented groups at university of which students with disabilities form one significant group (Beauchamp-Prior, 2013). There is plenty of recent research evidence to support this which relates to students entering university with a previously identified learning difference and this will be discussed more fully in the final thesis. But a compounding factor which suggests an even greater prevalence of dyslexia at university beyond data about dyslexic students on entry is indicated through the rising awareness of late-identified dyslexia at university. This is evidenced not the least through interest in creating screening tools such as the DAST (Dyslexia Adult Screening Test, Fawcett & Nicholson, 1998) and the LADS software package (Singleton & Thomas, 2002) to name just two technology-based items which will be discussed further, below. But this is also a measure of the recurring need to develop and refine a screening tool that works at university level which takes more interest in the other learning challenges as additional identifying criteria rather than persist with assessing largely literacy-based skills and the relationship of these to perhaps, speciously-defined, measures of 'intelligence'. This is also discussed a little more and in the context of this paper, below.
![]()
Recent thinking: describing dyslexia using a multifactoral approach
[key papers to report on here: Tamboer et al, 2014 'Five describing factors of dyslexia'; (Castles & Coltheart, 1992, 'Varieties of developmental dyslexia'); Pennington, 2006, 'From single to multiple deficit models of developmental disorders'; Le Jan et al, 2011, 'Multivariate predictive model for dyslexia diagnosis']
![]()
Disability, deficit, difficulty, difference or none of these?
With the exception of Cooper's description of dyslexia being an example of neuro-diversity rather than a disability, difficulty or even difference, definitions used by researchers and even professional associations such as the British Dyslexia Association, Dyslexia Action, The Dyslexia Foundation, The International Dyslexia Association, The American Dyslexia Association, all tend to remain focused on the issues, challenges and difficulties that dyslexia presents for individuals engaging with learning that is delivered through conventional curriculum processes. This approach tacitly compounds the 'adjustment' agenda which is focused on the learner rather than the learning environment.
 'Difficulty' or 'disorder' are both loaded with negative connotations that imply deficit, particularly within the framework of traditional human learning experiences in curriculum delivery environments that do remain almost entirely 'text-based'. This is despite the last decade or two of very rapid development of alternative, technology or media-based delivery platforms that have permeated western democracies and much of the alternative and developing worlds. This 'new way' is embraced by an information society that sees news, advertising, entertainment and 'gaming', government and infrastructure services, almost all aspects of human interaction with information being delivered through electronic mediums. And yet formal processes of education by and large remain steadfastly text-based which, although now broadly delivered electronically, still demand a 'conventional' ability to properly and effectively engage with the 'printed word' both to consume knowledge and also to create it. This persistently puts learners with dyslexia - in the broadest context - and with dyslexia-like learning profiles at a continual disadvantage and hence is inherently unjust. An interesting, forward-looking paper by Cavanagh (2013) succinctly highlights this tardiness in the delivery of education and learning to keep up with developments in information diversity and candidly observes that the collective field of pedagogy and andragogy should recognize that, rather than learners, it is curricula that is disabled and hence, needs be fixed – a standpoint that resonates with the underlying rationale that drives this PhD Project.
Cavanagh is one of the more recent proponents of a forward-facing, inclusive vision of a barrier-free learning environment - the Universal Design for Learning (UDL) – which as a 20-year-old 'movement' originating from a seminal paper by Rose & Meyer (2000) is attempting to tackle this issue in ways that would declare dyslexia to be much more widely recognized as, at worst, a learning difference amongst a plethora of others, rather than a learning difficulty or worse, disability. With its roots in the domain of architecture and universal accessibility to buildings and structures, the core focus of UDL is that the learning requirements of all learners are factored into curriculum development and delivery so that every student's range of skills, talents, competencies and challenges are recognized and accommodated without recourse to any kind of differentiated treatment to 'make allowances'. Hence it becomes the norm for learning environments to be much more easily adaptable to learners' needs rather than the other way around. This will ultimately mean that text-related issues, difficulties and challenges that are undoubted deficits in conventional learning systems cease to have much impact in a UDL environment. There is an increasing body of evidence to support this revolution in designing learning in this way, where researchers persistently draw attention to the learning-environment challenges facing different learners, ranging from equitable accommodation into the exciting new emphasis on developing STEM education (eg: Basham & Marino, 2013) to designing learning processes for properly including all students into health professions courses (eg: Heelan, et al, 2015).
Other measures are still required to ensure an element of equitability in learning systems that fail to properly recognize and accommodate learning diversity. Extensive earlier, and recently revisited research on learning styles has demonstrated (not unsurprisingly) that when teaching styles are aligned with student learning styles, the acquisition and retention of knowledge and more so, how it is subseqently re-applied, is more effective and fosters better learning engagement (Felder, 1988, Zhou, 2011, Tuan, 2011, Gilakjani, 2012) and that a mismatch between teaching and learning styles can cause learning failure, frustration and demotivation (Reid, 1987, Peacock, 2001). For example, preferences towards knowledge being presented visually is demonstrable in many dyslexic learners (Mortimore, 2008). There are arguments to support a neuro-biological explanation for this apparent preference which is based on investigations of the periphery-to-centre vision ratio metric. This describes the degree of peripheral vision bias in individuals' vision preferences and research evidence suggests that this is high in many people with dyslexia (Schneps et al, 2007) which means that many dyslexics evidence a preference towards favouring the peripheral vision field over the centre (Geiger & Lettvin, 1987). Ironically, this may also account for deficits in information searching capabilities often observable in many with dyslexia because accuracy in this activity relies on good centre-vision focus (Berget, 2016), it also may explain greater incidence of more acute visual comparative abilities and talents often associated with dyslexia. In learning environments this may be particularly significant where interrelationships between concepts are complex and would otherwise require lengthy textual explanations to clearly present meaning. Not least this is sometimes due to a comorbidity of dyslexia with attention deficit disorder where the dyslexic reader may experience difficulty in isolating key ideas or be easily distracted from, or find increasing difficulty in engaging with the reading task (Goldfus, 2012, Garagouni-Areou & Solomonidou, 2004) or simply find reading exhausting (Cirocki, 2014). Dyslexic learners often get lost in the words. However another detailed study of learning style preferences in adolescents which adopted the Visual-Auditory-Kinestetic learning styles model as the means for acquiring data revealed no significant differences between the learning styles of dyslexic participants and those with no indication of dyslexia although the research did demonstrate that dyslexic learners present a greater variety of learning style preferences than their non-dyslexic peers (Andreou & Vlachos, 2013). This is an interesting result which might be explained by suggesting that learning frustration experienced by more academically able dyslexic learners in attempting to engage with learning resources which, to them at least, present access challenges, is compensated by developing alternative learning strategies and styles which they match to meet the demands of learning situations as they are encountered. Many other studies in recent years have explored relationships between dyslexia and learning styles although conclusions reached appear mixed. For example, in the cohort of 117 university students with dyslexia used in Mortimore's (2003) study, no link was established between any preference for visuo-spatial learning styles and dyslexia which may seem unexpected in the light of other research suggesting that one of the characteristizing aspects of dyslexia can be elevated visuo-spatial abilities in certain circumstances (Attree et al, 2009). Indeed, common knowledge in professional practice in university level support for dyslexic students regularly advocates and provides assistive learning technologies that are designed to make learning more accessible for those with visual learning strengths. This continues to be a central provision of technology support for dyslexic students in receipt of the (UK) Disabled Students' Allowance . Searching for alternative means to provide easier access to learning for dyslexic students appears to have spawned other, interesting studies. For example, Taylor et al (2009) developed innovative animated learning materials, hoping to show that these provided improved learning access for students with dyslexia. However the outcome of the study showed that their animations were of equal learning value to both dyslexic and non-dyslexic students and attempted to explain this by suggesting that as with other forms of learning resources, non-dyslexic students typically find these easier to access than their dyslexic peers.
![]()
Labels, categories, dilemmas of difference, inclusivity
[introduce this section drawing on the seminal work by Minow M, 1991, 'Making all the difference' that set out the broad framework in the inclusion/exclusion debate for accommodating difference as the most valuable and meaningful 'label']
 There are many well-rehearsed arguments that have sought to justify the categorization of learners as a convenient exercise in expediency that is generally justified as essential for establishing rights to differentiated 'support' as the most efficacious forms of intervention (Elliott & Gibbs, 2008). This is support which aims to shoe-horn a learner labelled with 'special needs' into a conventional learning box, by means of the application of 'reasonable adjustments' as remediative processes to compensate for learning challenges apparently attributed to their disability.
Outwardly, this is neat, usually well-meaning, ticks boxes, appears to match learner-need to institutional provision, and apparently 'fixes' the learner in such a way as to level the academic playing field so as to reasonably expect such learners to 'perform' in a fair and comparable way with their peers. Richardson (2009) reported on analysis of datasets provided by HESA that this appears to work for most categories of disabled learners in higher education, also demonstrating that where some groups did appear to be under-performing, this was due to confounding factors that were unrelated to their disabilities.
However some researchers claim that such accommodations can sometimes positively discriminate, leading to unfair academic advantage because the 'reasonable adjustments' that are made are somewhat arbitrarily determined and lack scientific justification (Williams & Ceci, 1999). Additionally, there is an interesting concern that many students who present similar difficulties and challenges when tackling their studies to their learning-disabled peers but who are not officially documented through a process of assessment or identification (that is, diagnosis) are unfairly denied similar access to corresponding levels of enhanced study support. It is exactly this unidentified learning difference that the metric in this research study is attempting to reveal and the development of which is described in detail below. Anecdotal evidence from this researcher's own experience as an academic guide in higher education suggests that at university, many students with learning differences such as dyslexia have no inkling of the fact, which is supported by evidence (for example) from a survey conducted in the late 90s which reported that 43% of dyslexic students at university were only identified after they have started their courses (National Working Party on Dyslexia in HE, 1999).  Indeed it has also been reported that some students, witnessing their friends and peers in possession of newly-provided laptops, study-skills support tutorials and extra time to complete their exams all provided through support funding, go to some lengths to feign difficulties in order to gain what they perceive to be an equivalent-to-their-friends, but better-than-equal academic advantage over others not deemed smart enough to play the system (Harrison et al, 2008, Lindstrom et al, 2011).
But there is some argument to suggest that, contrary to dyslexia being associated with persistent failure (Tanner, 2009), attaching the label of dyslexia to a learner - whatever dyslexia is - can be an enabling and empowering process at university exactly because it opens access to support and additional aids, especially technology which has been reported to have a significantly positive impact on study (Draffan et al, 2007). Some researchers who investigated the psychosocial impacts of being designated as dyslexic have demonstrated that embracing their dyslexia enabled such individuals to identify and use many personal strengths in striving for success, in whatever field (Nalavany et al, 2011). In taking the neurodiversity approach however, Grant (2009) points out that neurocognitive profiles are complicated and that the identification of a specific learning difference might inadvertently be obfuscated by a diagnostic label, citing dyslexia and dyspraxia as being very different situations but which share many similarities at the neurocognitive level. Ho (2004) argued that despite the 'learning disability' label being a prerequisite for access to differentiated provision in learning environments and indeed, civil rights protections, these directives and legislations have typically provided a highly expedient route for officialdom to adopt the medical model of learning disabilities and pay less attention or even ignore completely other challenges in educational systems. 'Learning disabilities' (LD) is the term generally adopted in the US, broadly equivalent to 'learning difficulties' everywhere else, of which it is generally agreed that 'dyslexia' forms the largest subgroup; and the legislation that is relevant here is enshrined in the UK in the Disability Discrimination Act, later followed by the Disability Equality Duty applied across public sector organizations which included places of learning, all replaced by the Equality Act 2010 and the Public Sector Equality Duty 2011. So one conclusion that may be drawn here is that as long as schools, and subsequently universities persist in relying heavily on reading to impart and subsequently to gain knowledge, and require writing to be the principal medium for learners to express their ideas and hence for their learning to be assessed, pathologizing the poor performance of some groups of learners enables institutions to avoid examining their own failures (Channock, 2007).
 Other arguments focus on stigmatization associated with 'difference':
On the disability agenda, many studies examine the relationship between disability and stigma with several drawing on social identity theory. For example, Nario-Redmond et al (2012) in a study about disability identification outlined that individuals may cope with stigma by applying strategies that seek to minimize stigmatized attributes but that often this is accompanied by active membership of stigmatized groups in order to enjoy the benefit of collective strategies as a means of self-protection. Social stigma itself can be disabling and the social stigma attached to disability, not least given a history of oppression and unequal access to many, if not most of society's regimens, is particularly so. Specifically in an education context, there is not necessarily a connection between labels of so-called impairment and the categorization of those who require additional or different provision (Norwich, 1999). Indeed, there is a significant body of research that identifies disadvantages in all walks of life that result from the stigmatization of disabilities (eg: McLaughlin, et al, 2004, Morris & Turnbill, 2007, Trammel, 2009). Even in educational contexts and when the term is arguably softened to 'difficulties' or even more so to 'differences', the picture remains far from clear with one study (Riddick, 2000) suggesting that stigmatization may already exist in advance of labelling, or even in the absence of labelling at all. Sometimes the stigma is more associated with the additional, and sometimes highly visible, learning support - students accompanied by note-takers for example - designed to ameliorate some learning challenges (Mortimore, 2013) with some studies reporting a measurable social bias against individuals with learning disabilities who were perceived less favourably than their non-disabled peers (eg: Tanner, 2009, Valas, 1999,). This was not the least also evidenced from the qualitative data that has been collected in this current research project which will be more deeply analysed later, however an example presented here is representative of many similar others that were received:
Other arguments focus on stigmatization associated with 'difference':
On the disability agenda, many studies examine the relationship between disability and stigma with several drawing on social identity theory. For example, Nario-Redmond et al (2012) in a study about disability identification outlined that individuals may cope with stigma by applying strategies that seek to minimize stigmatized attributes but that often this is accompanied by active membership of stigmatized groups in order to enjoy the benefit of collective strategies as a means of self-protection. Social stigma itself can be disabling and the social stigma attached to disability, not least given a history of oppression and unequal access to many, if not most of society's regimens, is particularly so. Specifically in an education context, there is not necessarily a connection between labels of so-called impairment and the categorization of those who require additional or different provision (Norwich, 1999). Indeed, there is a significant body of research that identifies disadvantages in all walks of life that result from the stigmatization of disabilities (eg: McLaughlin, et al, 2004, Morris & Turnbill, 2007, Trammel, 2009). Even in educational contexts and when the term is arguably softened to 'difficulties' or even more so to 'differences', the picture remains far from clear with one study (Riddick, 2000) suggesting that stigmatization may already exist in advance of labelling, or even in the absence of labelling at all. Sometimes the stigma is more associated with the additional, and sometimes highly visible, learning support - students accompanied by note-takers for example - designed to ameliorate some learning challenges (Mortimore, 2013) with some studies reporting a measurable social bias against individuals with learning disabilities who were perceived less favourably than their non-disabled peers (eg: Tanner, 2009, Valas, 1999,). This was not the least also evidenced from the qualitative data that has been collected in this current research project which will be more deeply analysed later, however an example presented here is representative of many similar others that were received:
- "When I was at school I was told that I had dyslexia. When I told them I wanted to be a nurse [and go to university], they laughed at me and said I would not achieve this and would be better off getting a job in a supermarket" (respondent #48997796, available here)
Similar evidence relating to social bias was recorded by Morris & Turnbill (2007) through their study exploring the disclosure of dyslexia in cohorts of students who successfully made it to university to train as nurses, although it is possible that their similar conclusions to these other studies were confounded by nurses' awareness of workplace regulations relating to fitness to practice. This aspect of disclosure-reluctance has been mentioned earlier. It has also been recorded that the dyslexia (LD) label might even produce a differential perception of future life success and other attributes such as attractiveness or emotional stability despite such a label presenting no indication whatsoever about any of these attributes or characteristics (Lisle & Wade, 2014). Perhaps the most concerning, is evidence that parents and especially teachers may have lower academic expectations of young people attributed with learning disabilities or dyslexia based on a perceived predictive notion attached to the label (Shifrer, 2013, Hornstra et al, 2014) and that in some cases, institutional processes have been reported to significantly contribute to students labelled as 'learning-disabled' choosing study options broadly perceived to be less academic (Shifrer et al, 2013).
 As a key researcher and commentator of many years standing, Stanovich has written extensively on dyslexia, on inclusivity and the impact of the labelling of differences. His approach appears to be principally two-fold. Firstly to fuel the debate about whether dyslexia per se exists, a viewpoint that has emerged from the research and scientific difficulties that he claims arise from attempts to differentiate dyslexia from other poor literacy skills; and secondly that given that dyslexia in some definition or another is a quantifiable characteristic, argues strongly that as long as the learning disability agenda remains attached to aptitude-achievement discrepancy measurement and fails to be a bit more self-critical about its own claims, (Stanovich, 1999), its home in the field of research will advance only slowly. Indeed a short time later he described the learning disabilities field as 'not ... on a scientific footing and continu[ing] to operate on the borders of pseudoscience' (Stanovich, 2005, p103). His position therefore fiercely advocates a more inclusive definition of learning disabilities as being one which effectively discards the term entirely because it is 'redundant and semantically confusing' (op cit, p350) a persistent argument that others echo. Lauchlan & Boyle (2007) broadly question the use of labels in special education, concluding that aside from being necessary in order to gain access for support and funding related to disability legislation, the negative effects on the individual can be considerable and may include stigmatization, bullying, reduced opportunities in life and perhaps more significantly, lowered expectations about what a 'labelled' individual can achieve (ibid, p41) as also reported above. Norwich (1999, 2008, 2010) has written extensively about the connotations of labelling, persistently arguing for a cleaner understanding of differences in educational contexts because labels are all too frequently stigmatizing and themselves disabling, referring to the 'dilemma of difference' in relation to arguments 'for' and 'against' curriculum commonality/differentiation for best meeting the educational needs of differently-abled learners. Armstrong & Humphrey (2008) suggest a 'resistance-accommodation' model to explain psychological reactions to a 'formal' identification of dyslexia, the 'resistance' side of which is typically characterized by a disinclination to absorb the idea of dyslexia into the self-concept, possibly resulting from perhaps more often, negatively vicarious experiences of the stigmatization attached to 'difference', whereas the 'accommodation' side is suggested to take a broadly positive view by making a greater effort to focus and build on the strengths that accompany a dyslexic profile rather than dwell on difficulties and challenges.
 McPhail & Freeman (2005) have an interesting perspective on tackling the challenges of transforming learning environments and pedagogical practices into genuinely more inclusive ones by exploring the 'colonizing discourses' that disenfranchise learners with disabilities or differences through a process of being 'othered'. Their conclusions broadly urge educationalists to have the courage to confront educational ideas and practices that limit the rights of many student groups (ibid, p284). Pollak (2005) reports that one of the prejudicious aspects of describing the capabilities of individuals under assessment is the common use of norm-referenced comparisons. This idea is inherently derived from the long-established process of aligning measurements of learning competencies to dubious evaluations of 'intelligence', standardized as these might be (for example Wechsler Intelligence Scale assessments to identify just one), but which fail to accommodate competencies and strengths which fall outside the conventional framework of 'normal' learning capabilities - that is, in accordance with literacy-dominant education systems.
Norwich (2013) also talks more about 'capabilities' in the context of 'special educational needs', a term he agrees, is less than ideal. The 'capability approach' has its roots in the field of welfare economics, particularly in relation to the assessment of personal well-being and advantage (Sen, 1999) where the thesis is about individuals' capabilities to function. Norwich (op cit) puts the capability approach into an educational context by highlighting focus on diversity as a framework for human development viewed through the lens of social justice which is an interesting parallel to Cooper's thesis on diversity taken from a neurological perspective as discussed above. This all has considerable relevance to disability in general but particularly to disability in education where the emphasis on everyone becoming more functionally able (Hughes, 2010) is clearly aligned with the notion of inclusivity and the equal accommodation of difference because the focus is inherently positive as opposed to dwelling on deficits. and connects well with the principles of universal design for learning outlined above.
![]()
Impact of the process of identification
Having said all this, exploring the immediate emotional and affective impact that the process of evidencing and documenting a learner's study difficulties has on the individual under scrutiny is a pertinent and emerging research field. (Armstrong & Humphrey, 2008). Perhaps as an indication of an increasing awareness of the value of finding out more about how an individual with dyslexia feels about their dyslexia, there have been relatively recent research studies that relate life/learning histories of individuals with dyslexia (eg: Dale & Taylor, 2001, Burden & Burdett, 2007, Evans, 2013, Cameron & Billington, 2015, Cameron, 2016). One intriguing study attempts to tease out meaning and understanding from these through the medium of social media (Thomson et al, 2015) where anonymous 'postings' to an online discussion board hosted by a dyslexia support group resulted in three, distinct categories of learning identities being established: learning-disabled, differently-enabled, and societally-disabled. The researchers observed from these postings that while some contributors took on a mantle of 'difference' rather than 'disability', expressing positiveness about their dyslexia-related strengths, most appeared to be indicating more negative feelings about their dyslexia, with some suggesting that their 'disability identity' had been imposed on them (ibid, p1339) not the least arising through societal norms for literacy.
The pilot study that underpins this current research project (Dykes, 2008) also explored feelings about dyslexia which was designed as a secondary aspect of its data collection process but it emerged that individuals responding to the enquiry were keen to express their feelings about their dyslexia and how they felt that it impacted on their studies. In the light of the findings of this earlier research, perhaps it should have been unsurprising to note in this current project, the significant number of questionnaire replies that presented quite heartfelt narratives about the respondents' dyslexia. Some 94% of the 98 QNR replies returned by students with dyslexia included data at this level. The complete portfolio of narratives can be accessed on the project webpages here and it is intended to explore this rich pool of qualitative data as the constraints of the project permit although it is anticipated that it likely that further, post-project research will be required in due course to fully understand it.
It may be through a collective study (in the future) of others' research in this area that conclusions can be drawn relating to the immediate impact on individuals when they learn of their dyslexia. However in the absence of any such meta-analysis being unearthed so far, even a cursory inspection of many of the learning histories presented in studies that have been explored to date generally reveals a variety of broadly negative and highly self-conscious feelings when individuals learn of their dyslexia. Although such reports strongly outweigh those from other learners who claimed a sense of relief that the 'problem' has been 'diagnosed' or that an explanation has been attributed to remediate their feelings of stupidity as experienced throughout earlier schooling, it is acknowledged that there is some evidence of positive experiences associated with learning about ones dyslexia, as reported earlier. This current project aims to be a contributor to this discourse as one facet of the questionnaire used to collect data sought to find out more about how dyslexic students learned about their dyslexia. A development feature of the project will co-relate the disclosures provided to respondents' narratives about how they feel about their dyslexia where this information has also been provided. As yet, a methodology for exploring this has still to be developed and this process may also be more likely to be part of the future research that it is hoped will stem from this current project.
However, and as already explored variously above, it seems clear that in the last two decades at least, many educators and researchers in the broad domain of revisiting the scope and presentation of tertiary-level learning and thinking are promoting a more enlightened view. It is one that rails against the deficit-discrepancy model of learning difference. It seeks to displaces entrenched ideology rooted in medical and disability discourses with one which advocates a paradigm shift in the responsibility of the custodians of knowledge and enquiry in our places of scholarship to one which more inclusively embraces learning and study diversity. There is a growing advocacy that takes a social-constructionist view to change the system rather than change the people (eg: Pollak, 2009), much in line with the Universal Design for Learning agenda briefly discussed above. Bolt-on 'adjustments', well-meaning as they may be, will be discarded because they remain focused on the 'disabling' features of the individual and add to the already burdensome experiences of being part of a new learning community - a factor which of course, affects everyone coming to university.
 To explore this point a little further, an example that comes to mind is technology 'solutions' that are designed to embed alternative practices and processes for accessing and manipulating information into not only so-called 'disabled' learners' but into everyone's study strategies. These are to be welcomed and great encouragement must be given to institutions to experiment with and hopefully adopt new, diverse practices of curriculum delivery although the rapid uptake of this seems unlikely in the current climate of financial desperation and austerity being experienced by many of our universities at this time. Having said this, encouraging or perhaps even requiring students to engage with technology in order to more easily facilitate inclusivity in study environments can raise other additional learning issues such as the investment in time necessary to master the technology (Dykes, 2008). These technologies may also remain too non-individualized nor easy-to-match to the learning strengths and weaknesses of many increasingly stressed students (Seale, 2008). So for differently-abled learners, these 'enabling' solutions may still require the adoption of additional, compensatory study practices, and may often be accompanied by an expectation to have to work and study harder than others in their peer-group in an academy which requires continuous demonstration of a high standard of literacy as a marker of intellectual capability (Cameron & Billington, 2015) and which moves to exclude and stigmatize those who cannot produce the expected academic outcome in the 'right' way (Collinson & Penketh, 2013). Eventually we may see this regime displaced by processes that will provide a much wider access to learning resources and materials that are available in a variety of formats and delivery mediums, the study of which can be assessed and examined through an equally diverse range of processes and procedures that carry equal merit. No apology is made for persistently returning to this point.
![]()
To identify or not to identify? - Is that the question?

So a dilemma arises about whether or not to (somehow) identify learning differences. On the one hand, there is a clear and strong argument that favours changing the system of education and learning so that difference is irrelevant, whilst on the other, the pragmatists argue that taking such an approach is idealistic and unachievable and that efforts should be focused on finding better and more adaptable ways to 'fix' the learner.
In the short term at least the pragmatists' approach is the more likely one to be adopted but in doing so, constructing an identification process for learning differences that attributes positiveness onto the learning identity of the individual rather than burdens them with negative perceptions of the reality of difference would seem to be a preference. This is important for many reasons, not the least of which is that an assessment/identification/diagnosis that focuses on deficit or makes the 'subject' feel inadequate or incompetent is likely to be problematic however skilfully it may be disguised as a more neutral process. Not the least this may be due to the lasting, negative perception that an identification of dyslexia often brings, commonly resulting in higher levels of anxiety, depressive symptoms, feelings of inadequacy and other negative-emotion experiences which are widely reported (eg: Carroll & Iles, 2006, Ackerman et al, 2007, Snowling et al, 2007). This is especially important to consider in the design of self-report questionnaire processes where replies are likely to be more reliable if the respondents feel that the responses they provide are not necessarily portraying them poorly, particularly so in the self-reporting of sensitive information that may be adversely affected by social influences and which can impact on response honesty (Rasinski et al, 2004).
Devising a process for gauging the level of dyslexia that an individual may present is only of any value in an educational context. Indeed, it is hard to speak of this without referring to severity of dyslexia which is to be avoided - in the context of this paper at least - because it instantly contextualizes dyslexia into the deficit/discrepancy model. However and as already mentioned, in the current climate labelling a learner with a measurable learning challenge does open access to learning support intended to compensate for the challenge. At university level, this access is based on the professional judgment of a Needs Assessor and on an identification of mild, moderate or severe dyslexia, with the extent of learning support that is awarded being balanced against these differentiated categories of disability, even though the differentiation boundaries appear arbitrary and highly subjective. This support in the first instance is financial and economic, notably through the award of the Disabled Students' Allowance (DSA) which provides a substantial level of funding for the purchase of technology, other learning-related equipment and personally-tailored study support tutorials. This is usually in addition to wider 'reasonable adjustments' provided as various learning concessions by the institution, such as increased time to complete exams. To date, and with the exception of a study by Draffan et al (2007) into student experiences with DSA-awarded assistive technology to which one conclusion indicated the significant numbers of recipients electing not to receive training in the use of the technology that they had been supplied with, no other research enquiries have been found so far that explore the extent to which assistive technology provided through the DSA, for example, is effective in properly ameliorating the challenges that face the dyslexic student learning in current university environments, nor indeed to gauge the extent to which this expensive provision is even utilized at all by recipients. Research into the uptake of differentiated study support for students with dyslexia also identified a substantial time lag between a formal needs assessment and the arrival of any technology equipment for many students (Dykes, 2008) which is likely to be a contributing factor to the low uptake of this type of learning support because students simply become tired of waiting for the promised equipment and instead just get on with tacking their studies as best they can. So it comes as no surprise that the award of DSA funding for students with dyslexia is under review at this time as perhaps this is an indication of how financial custodians have also observed the apparent ambivalency towards technology assistance from students in receipt of the funding, which ironically may be more due to systemic failures than to a perceived vacillation amongst students - more of this below.
However, to return to the point, one of the main aspects of this research project is a reliance on finding students at university with an unidentified dyslexia-like profile as a core process for establishing measurable differences in academic agency between identified and unidentified 'dyslexia', with this being assessed through the Academic Behavioural Confidence metric developed by Sander & Sanders (2006). So to achieve this, incorporating some kind of evaluator that might be robust enough to find these students is key to the research methodology. A discussion about how this has been achieved is presented in the next section.
![]()
Measuring dyslexia - "how 'dyslexic' am I?"
It might be thought that 'measuring dyslexia' is a natural consequence of 'identifying dyslexia' but the commonly used dyslexia screening tools offer, at best, an output that requires interpretation and in UK universities, this is usually the task of a Disability Needs Assessor. Given an indication of dyslexia that results from a screening, what usually follows is a recommendation for a 'full assessment' which, in the UK at least, has to be conducted by an educational psychologist. However even such a comprehensive and daunting 'examination' does not produce much of a useful measurement to describe the extent of the dyslexic difference identified, other than a generally summative descriptor of 'mild', 'moderate' or 'severe', some assessment tools do provide scores obtained on some of the tests that are commonly administered. Nevertheless, these are generally are of use only to specialist practitioners and not usually presented in a format that is very accessible to the individual under scrutiny.
One student encountered in this researcher's role as a dyslexia support specialist at university recounted that on receiving the result of his assessment which indicated that he had a dyslexic learning difference, he asked the assessor: 'well, how dyslexic am I then?' He learned that his dyslexia was 'mild to moderate' which left him none the wiser, he said. One of his (dyslexic) peers later recounted that his view was that he did not think dyslexia was real because he believed that 'everyone if given the chance to prove it, could be a bit dyslexic' (respondent #9, Dykes, 2008, p95). His modest conclusion to account for his learning challenges was that his problem was that he was just not as intelligent as others, or thought that perhaps his lack of confidence from an early age decreased his mental capacity.
On the one hand, certainly for school-aged learners, identifying dyslexia is rooted in establishing capabilities that place them outside the 'norm' in assessments of competencies in phonological decoding and automaticity in word recognition and in other significantly reading-based evaluations. This has been mentioned briefly earlier. Some identifiers include an element of assessment of working memory such as the digit span test, which has relevance to dyslexia because working memory abilities have clear relationships with comprehension. If a reader gets to the end of a long or complex sentence but fails to remember the words at the beginning long enough to connect with the words at the end then clearly this compromises understanding. All of these identifiers also carry quantifiable measures of assessment although they are discretely determined and not coalesced into an overall score or value. Besides, there is widespread agreement amongst psychologists, assessors and researchers that identifiers used for catching the dyslexic learner at school do not scale up very effectively for use with adults (eg: Singleton et al, 2009). This may be especially true for the academically able learners that one might expect to encounter at university who can, either actively or not, mask their difficulties (Casale, 2015) or even feign them if they perceive advantage to be gained (Harrison et al, 2008) as also reported above. However, recent studies continue to reinforce the idea that dyslexia is a set of quantifiable cognitive characteristics (Cameron, 2016) but which extend beyond the common idea that dyslexia is mostly about poor reading, certainly once our learner progresses into the university environment.
 Hence is it widely reported (and mentioned elsewhere in this paper) that dyslexia in one form or another persists into adulthood (Hanley, 1997, Elbro et al, 1994, Kirby et al, 2008) and this is especially apparent in studies that focus on the impact of phonological awareness on reading ability (Shaywitz et al, 1999, Svensson & Jacobson, 2003). It is also evident that identifying dyslexia in adults is more complicated than in children, especially in broadly well-educated adults attending university because many of the early difficulties associated with dyslexia have receded as part of the progression into adulthood (Kemp et al, 2008, Undheim, 2009) either as a result of early support or through self-developed strategies to overcome them. Such individuals have come to be regarded as 'as compensated adult dyslexics' in some studies (eg: Lefly & Pennington, 1991), at least in regard to their phonological processing skills and hence reading abilities. The research is far from conclusive about the reasons for dyslexia compensation, most So it is of significant interest to note that very recent research concerning the abilities of dyslexic university students to overcome the persistent phonological deficits which have essentially characterized the identification of their dyslexia, suggests that this may be achieved through their development of morphological knowledge in reading (Cavalli et al, 2017). Their study revealed that the higher-functioning adults that comprised their sample of university students (n=40) there was a significant disassociation between the development morphological abilities and phonological ones and that the magnitude of this disassociation correlated with reading ability (ibid, p63). This result was in keeping with an earlier study (Martin et al, 2014) which also suggested that this development in strong morphological awareness could be a significant compensation in the development of literacy skills for dyslexic students with both of these recent studies building on an increasing body of research that is exploring which aspects of the reading ability required in university students have been compensated in those with dyslexia and how this compensation has been executed (eg: Parrila & Georgiou, 2008). What emerges from this paragraph's overview is evidence that at university, other dimensions of dyslexia that are aside from reading ability and phonological processing may be more characteristic of many dyslexic university students' learning needs and hence, identification and assessment processes that still have literacy and decoding skills at their core are less relevant than such tests may have been for earlier-years learners.
However even when strong indicators of dyslexic difficulties persist into higher education, comprehensive and daunting 'examinations' by an educational psychologist are unlikely to produce much by way of useful measurements to describe the extent of the dyslexic difference identified, that is, an individuals level of dyslexia-ness. Most usually, a generally summative descriptor such as 'mild', 'moderate' or 'severe' dyslexia may be the best outcome. This project is fundamentally interested in the concept of 'dyslexia-ness' becuase without gaining a sense about where an individual's learning and study profile lies along the spectrum of characteristics conventionally associated with dyslexia but may, to some degree, equally occur in apparently non-dyslexic learners, it would not have been possible to identify the key research subgroup of non-dyslexic students who are nevertheless presenting many of the learning characteristics often associated with dyslexia. Some assessment tools do provide scores obtained on some of the tests that are commonly administered but these are generally only meaningful to specialist practitioners and not usually presented in a format that is very accessible to the assessed individual. Aside from facilitating a route towards focused study skills support interventions, when a screening for dyslexia indicates that a full assessment from an educational psychologist is prudent, this becomes an essential component for any claim to the Disabled Students' Allowance (DSA) although ironically the assessment has to be financed by the student and is not recoverable as part of any subsequent award. This in itself may be a barrier to formal assessment, suggesting that as a consequence, university community include a significant proportion of dyslexic students who choose not formalize their learning difference, and hence, open opportunities for the targeted learning support benefits that are provided for dyslexic students in most universities. It is of note, however, that with a recent refocusing of the target group of disabled students who are able to benefit from the DSA (Willetts, 2014) access to this element of support is likely to be withdrawn for the majority of students with dyslexia at university in the foreseeable future although for this current academic year (2016/17) it is still available. This may be an indication that dyslexia is no longer 'officially' considered as a disability, which is at least consistent with the standpoint of this research project, although it is more likely that the changes are as a direct result of reduced government funding to support students with additional needs at university rather than any greater understanding of dyslexia based on informed, research-based recommendations.
The last two decades or so have seen the development of a number of assessments and screening tests that aim to identify – but not specifically to measure - dyslexia in adults and particularly in higher education contexts as a response to the increasing number of students with dyslexia attending university. An early example of a screening assessment for adults is the DAST (Dyslexia Adult Screening Test) developed by Nicholson & Fawcett (1997). This is a modified version of an earlier screening tool used with school-aged learners but which followed similar assessment principles, that is, being mostly based on literacy criteria although the DAST does include non-literacy based tests, namely a posture stability test – which seems curiously unrelated although it is claimed that its inclusion is substantiated by pilot-study research - a backward digit span test and a non-verbal reasoning test. Literature review appears to indicate that some researchers identify limitations of the DAST to accurately identify students with specific learning disabilities, for example Harrison & Nichols (2005) felt that their appraisal of the DAST indicated inadequate validation and standardization. Computerized screening tools have been available for some time, such as the LADS (Lucid Adult Dyslexia Screening, (Lucid Innovations, 2015)) which claims to generate a graphical report that collects results into a binary categorization of dyslexia as the individual being 'at risk' or 'not at risk'. Aside from being such a coarse discriminator, 'at risk' again appears to be viewing dyslexia through the lens of negative and disabling attributes. The screening test comprises 5 sub-tests which measure nonverbal reasoning, verbal reasoning, word recognition, word construction and working memory (through the backward digit span test) and indicates that just the final three of these sub-tests are dyslexia-sensitive. The reasoning tests are included based on claims that to do so improves screening accuracy and that results provide additional information 'that would be helpful in interpreting results' (ibid, p13), that is, provides a measure of the individual's 'intelligence' - which, in the light of Stanovich's standpoint on intelligence and dyslexia mentioned earlier, is of dubious worth.
 Warmington et al (2013) responded to the perception that dyslexic students present additional learning needs in university settings, implying that as a result of the increased participation in higher education in the UK more generally there is likely to be at least a corresponding increasing in the proportion of students who present disabilities or learning differences. Incidentally,, Warmington et al quotes HESA figures for 2006 as 3.2% of students entering higher education with dyslexia. A very recent enquiry directly to HESA elicited data for 2013/14 which indicated students with a learning disability accounting for 4.8% of the student population overall (Greep, 2015), and also representing some 48% of students disclosing a disability, which certainly will make students with dyslexia the biggest single group of students categorized with disabilities at university, such that they are currently labelled. It is of note that the HESA data is likely to be an under-reporting of students with a learning disability - that is, specific learning difficulty (dyslexia) because where this occurs together with other impairments or medical/disabling conditions this is reported as a separate category with no way of identifying the multiple impairments. At any rate, both of these data are consistent with the conclusions that the number of students with dyslexia entering university is on the rise. Given earlier mention above about dyslexia being first-time identified in a significant number of students post-entry it is reasonable to suppose that the actual proportion of dyslexic students at university is substantial. Indeed, this research is relying on finding 'hidden' dyslexics in the university community in order to address the research questions and hypothesis.
The York Adult Assessment-Revised (YAA-R) was the focus of the Warmington et al study which reported data from a total of 126 students of which 20 were known to be dyslexic. The YAA-R comprises several tests of reading, writing, spelling, punctuation and phonological skills that is pitched most directly to assess the abilities and competencies of students at university (ibid, p49). The study concluded that the YAA-R has good discriminatory power of 80% sensitivity and 97% specificity but given that the focus of the tests is almost entirely on literacy-based activities, it fails to accommodate assessments of the wide range of other strengths and weaknesses often associated with a dyslexic learning profile that are outside the envelope of reading, writing and comprehension. A similar criticism might be levelled at the DAST as this largley focuses on measuring literacy-based deficits. Indeed, Channock et al (2010) trialed a variation of the YAA-R adjusted in Australia to account for geographical bias in the UK version as part of a search for a more suitable assessment tool for dyslexia than those currently available. Conclusions from the trial with 23 dyslexic students and 50 controls were reported as 'disappointing' due not 'to the YAA-R's ability to differentiate between the two groups, but with it's capacity to identify any individual person as dyslexic' (ibid, p42) as it failed to identify more than two-thirds of previously assessed dyslexic students as dyslexic. Channock further narrates that self-reporting methods proved to be a more accurate identifier - Vinegrad's (1994) Adult Dyslexia Checklist was the instrument used for the comparison. A further criticism levelled at the YAA-R was that it relied on data collected from students in just one HE institution, suggesting that that differences between students in different institutions was an unknown and uncontrollable variable which was not accounted for but which might influence the reliability and robustness of the metric.
Aside from the use of norm-referenced evaluations for identifying dyslexia as a discrepancy between intellectual functioning and reading ability being controversial, one interesting study highlighted the frequently neglected factors of test reliability and error associated with a single test score, with a conclusion that a poor grasp of test theory and a weak understanding of the implications of error can easily lead to misdiagnosis (Cotton et al, 2005) in both directions – that is, generating both false positives and false negatives.
Tamboer & Vorst (2015) developed an extensive self-report questionnaire-based assessment to screen for dyslexia in students attending Dutch universities. Divided into three sections: biographical questions, general language statements, and specific language statements, which although still retaining a strong literacy-based focus, this assessment tool does include items additional to measures of reading, writing and copying, such as speaking, dictation and listening. In the 'general language statements' section some statements also referred to broader cognitive and study-related skills such as 'I can easily remember faces' or 'I find it difficult to write in an organised manner'. This seems to be making a better attempt at developing processes to gauge a wider range of attributes that are likely to impact on learning and study capabilities in the search for an effective identifier for dyslexia in university students. This model is consistent with an earlier self-report screening assessment which in its design, acknowledged that students with dyslexia face challenges at university that are in addition to those associated with weaker literacy skills (Mortimore & Crozier, 2006). In contrast to Channock's findings concerning the YAA-R reported above, Tamboer & Voorst's assessment battery correctly identified the 27 known dyslexic students in their research group - that is, students who had documentary evidence as such - although it is unclear how the remaining 40 students in the group of 67 who claimed to be dyslexic were identified at the pre-test stage. Despite this apparent reporting anomaly, this level of accuracy in identification is consistent with their wider review of literature concluding that there is good evidence to support the accuracy of self-report identifiers (ibid, p2).

Thus, in none of the more recently developed screening tools is there mention of a criterion that establishes how dyslexic a dyslexic student is - that is, the severity of the dyslexia (using 'severity' advisedly as in itself, the term reverts to the model that to be dyslexic is to be disadvantaged, as mentioned earlier). Elliott & Grigorenko (2014) claim that a key problem in the development of screening tools for dyslexia is in setting a separation boundary between non-dyslexic and dyslexic individuals that is reliable and which cuts across the range of characteristics or attributes that are common in all learners in addition to literacy-based ones and especially for adults in higher education. To this end, it was felt that none of the existing evaluators would be able to not only accurately identify a dyslexic student from within a normative group of university learners - that is, students who include none previously identified as dyslexic nor any who are purporting to be dyslexic - but also be able to ascribe a measure of the dyslexia to the identification. In addition, and given the positive stance that this project takes towards including learners with dyslexia-like profiles into an integrated and universal learning environment, the design of the evaluator needed to ensure that all students who used it felt that they are within its scope and that it would not reveal a set of study attributes that were necessarily deficit- nor disability-focused. For this research at least, it was felt that such a metric should be developed and needs to satisfy the following criteria:
- it is a self-report tool requiring no administrative supervision;
- it is not entirely focused on literacy-related evaluators, and attempts to cover the range of wider academic issues that arise through studying at university;
- it includes some elements of learning biography;
- its self-report stem items are equally applicable to dyslexic as to apparently non-dyslexic students;
- it is relatively short as it would be part of a much larger self-report questionnaire collecting data about the 7 other metrics that are being explored in this research project;
- it draws on previous self-report dyslexia identifiers which could be adapted to suit the current purpose to add some prior, research-based validity to the metric;
- the results obtained from it will enable students to be identified who appear to be presenting dyslexia-like attributes but who have no previous identification of dyslexia;
- through further development work in due course, it will connect with the psychometric profile maps (available here), generated from data also collected in the main project questionnaire, in ways that are bidirectional, leading to a validation of the profile maps as an additional discriminator for identifying dyslexia in higher education students. [The profile maps reflect the data collected on the 6 psychometric scales: Learning Related Emotions (LRE), Anxiety Regulation & Motivation (ARM), Academic Self-efficacy (ASE), Self-esteem (SE). Learned Helplessness (LH) and Academic Procrastination (AP). More about these is available on the project's webpages].
![]() This metric is being described as the Dyslexia Index of a student's learning profile and will attempt to collectively quantify learning, study and learning-biography attributes and characteristics into a comparative measure which can be used as a discriminator between students presenting a dyslexic or a non-dyslexic profile. The measure is akin to a coefficient and hence adopts no units. The tool that has been developed to generate the index value will be referred to as the Dyslexia Index Profiler, and Dyslexia Index will be frequently abbreviated to Dx. This is all despite the researcher's unease with the use of the term 'dyslexia' as a descriptor of a wide range of learning and study attributes and characteristics that can be observed and objectively assessed in all learners in university settings. However, in the interests of expediency, the term will be used throughout this study.
This metric is being described as the Dyslexia Index of a student's learning profile and will attempt to collectively quantify learning, study and learning-biography attributes and characteristics into a comparative measure which can be used as a discriminator between students presenting a dyslexic or a non-dyslexic profile. The measure is akin to a coefficient and hence adopts no units. The tool that has been developed to generate the index value will be referred to as the Dyslexia Index Profiler, and Dyslexia Index will be frequently abbreviated to Dx. This is all despite the researcher's unease with the use of the term 'dyslexia' as a descriptor of a wide range of learning and study attributes and characteristics that can be observed and objectively assessed in all learners in university settings. However, in the interests of expediency, the term will be used throughout this study.
[insert here: section detailing a previous attempt to develop an electronic, computerized dyslexia screening assessment (Haslam & Kiziewicz, 2001) built on thesis by Zdzienski (1998)]
To recap: the principle focus of this research project is exploring the linkage between dyslexia and academic agency in higher education students. Zimmerman (1995) neatly explained that academic agency can be thought of as a sense of [academic] purpose, this being a product of self-efficacy and academic confidence and which is then the major influence on academic accomplishment (ibid). An extensive review of academic agency in the context of its applicability to university learning is beyond the scope of this project, but specifically in relation to its major component factors – those of academic self-efficacy and academic confidence – a detailed review will be presented in the final thesis with an preliminary discussion available here. Thus, given that the construct of academic agency is an umbrella term for at least the two more specific sub-constructs mentioned, this research project concentrates particularly on the attribute of academic confidence and this has been explored through the use of Sander & Sanders (2006) metric, the Academic Behavioural Confidence Scale – originally a 24-item scale and which is included in the main research questionnaire. Although originally developed as the Academic Confidence Scale, it was renamed following a review of the structure and focus which identified a keener applicability to actions and plans related to academic study (ibid). Hence measurements about student confidence acquired through the ABC Scale will be the the 'output variable' from which comparisons will be made between students with identified dyslexia, students with hidden and unidentified dyslexia-like profile and non-dyslexic students, as determined through the 'input variable' of Dyslexia Index
[10491 /63,074 (at 08 Jan 2018)]
![]()
2. Academic Confidence
Overview
Confidence is a robust dimensional characteristic of individual differences (Stankov, 2012). Confidence can be considered as a sub-construct of self-efficacy where self-efficacy is concerned with an individual's context specific beliefs about the capability to get something done (Bandura, 1995). Students who enter higher education or college with confidence in their academic abilities to perform well do perform significantly better than their less-confident peers. (Chemers et al, 2001). If individuals believe that they have no power to produce results then they will not attempt to make them happen (Bandura, 1997) and specifically, when students lack confidence in their capacity to tackle academic tasks they are less likely to engage positively with them (Pajares & Schunk, 2002). Academic confidence can be thought of as a mediating variable - that is, it acts bi-directionally - between individuals' inherent abilities, their learning styles and opportunities presented in the environment of higher education (Sander & Sanders, 2003) and particularly when academic confidence is fostered as part of learning community initiatives, it can be an important contributor to academic success (Allen & Bir, 2012).
Thus, confidence can be regarded as students’ beliefs that attaining a successful outcome to a task is likely to be the positive reward for an investment of worthwhile effort (Moller et al, 2005). Conversely, in those for whom confidence in their academic abilities is weak, these learners can interpret the accompanying anxiety related to academic performance as a marker of their incompetence which may be an incorrect attribution and which in turn may lead to exactly the fear of failure that has generated the anxiety (Usher & Pajares, 2008). Perceptions of capability and motivation, which include judgements of confidence, feature significantly in self-concept theories, in particular, social cognitive theory. This is where beliefs in personal efficacy are thought to be better predictors of academic outcomes than actual abilities or evidence from prior performance, because these beliefs are fundamental in establishing how learners are likely to tackle the acquisition of new knowledge and academic skills and how they will apply these productively, leading to positive and worthwhile outcomes (Pajares & Miller, 1995).
Social Cognitive Theory (SCT) enshrines these ideas and has been developed through decades of research and writing, particularly by Bandura (commencing: 1977) and other, subsequent theorists and researchers in psychology and educational psychology who have taken a similar perspective on the processes and rationales which drive the interactivity of humans with the environment and with each other. The underlying principle in social cognitive theory is that it is an attempt to provide explanations for the processes that drive and regulate human behaviour according to a model of emergent interactive agency (Bandura, 1986). This is a model which attributes the causes of human behaviour to multifactoral influences derived principally from the reciprocal interactions between inherent personal characteristics, the local and wider environment that surrounds the domain of behavioural functioning, and the behaviour itself. As such, considerable interest in SCT has been expressed by educationalists and education researchers seeking to apply and integrate the ideas enshrined in the theory into a clearer understanding of the functions of teaching and learning processes, especially for making these more effective mechanisms for the communicating of knowledge and the expression of ideas, and for interpreting the roots and causes of both academic failure and success.
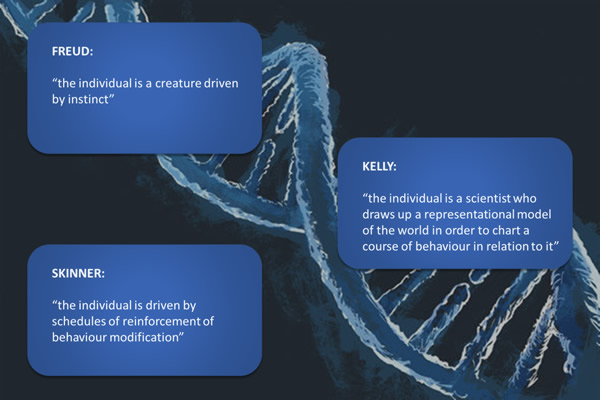 Within this over-arching theory, the position of self-efficacy as a social psychological construct that relates self-belief to individual actions is a central and fundamental element. Self-belief is a component of personal identity and we might trace some of the roots of Bandura’s theories to earlier work on personal construct theory asserting that an individual’s behaviour is a function of not only the ways in which they perceive the world around them, but more particularly how they construct their world-view in such a way that enables them to navigate a path through it (Kelly, 1955). Along this route from Kelly to Bandura can be found the important, Rogersian ‘person-centred approach’ which takes as its focus the concept of the ‘actualizing tendency’ by which is meant the basic human processes that enable the accomplishment of our potential by developing our capacities to achieve outcomes (Rogers, 1959). We can see the embodiment of this in higher education contexts through institutions seeking to adopt a ‘student-centred’ learning environment where the aim is to shift the focus from a didactic curriculum presentation to systems of knowledge delivery and enquiry which is more co-operative and student self-managed, with varying degrees of success (O’Neill & McMahon, 2005).
These underpinning arguments and theses relating to human functioning have influenced the development of social cognitive theory by illuminating the mechanisms and processes that control and regulate the ways in which we behave and operate from a very different perspective to earlier arguments. Typically, those were based on either the psycho-analytic framework of Freud, or the strongly stimulus-response behaviourist principles proposed by Watson (1913), which attracted considerable interest from later psychologists eager to apply these to the learning process, perhaps the most notable being Skinner (eg: 1950), and which externalized behaviour to the exclusion of cognitive processes.
Space and scope does not permit a full documentation of the historical development of all these competing theories in the narrative that follows, and so the focus will firstly be on exploring Social Cognitive Theory, as a highly influential late-twentieth century proposition that took a fairly radical new approach in its suggestions about how human behaviour is controlled and regulated by how we think, what influences these thought processes, and how these are transformed into consequential behavioural actions; and secondly, close attention will be paid to unpicking the somewhat elusive construct of academic confidence as viewed through the lens of the self-efficacy component of Social Cognitive Theory. Lastly, a research development of academic confidence, namely Academic Behavioural Confidence (Sander & Sanders, 2006), will be considered in terms of its roots in SCT, its linkages with academic self-efficacy, its development through numerous studies that have used it as the principal metric in their research and concluding with the specifics of how it has been used in this research project to explore the relationships between dyslexia and academic confidence in university students.
![]()
Key Research Perspectives
Bandura - Social Cognitive Theory (SCT), and the self-efficacy component of SCT in learning contexts
In social cognitive theory (SCT), learning is considered as the process of knowledge acquisition through absorbing and thinking about information (Stajkovic & Luthans, 1998). The influence of Bandura’s original (1977) and subsequent work in developing social cognitive theory has had a major influence on education researchers because many of the components in SCT have been shown to significantly impact on understanding learning processes more clearly by adopting a more social construction of learning – that is, learning behaviour is considered, explored and theorized within the context of the environment where the learning takes place (Bredo, 1997). This is in contrast to behaviourist or experiential constructions, both of which have been popular at times and should be duly credited for their contribution to the ever-evolving field of the psychology of education and learning. Indeed the most recent ‘construction’ to explain learning claims greater pertinency in the so-called ‘digital age’ by arguing that all previous theories about learning are becoming outdated because they are all antecedent to the technological revolution that is now pervasive in most, more modern places of learning.
 Briefly, this latest thesis is known as connectivism, (Siemens, 2005) and the idea is that the personal learning spaces of individuals now extend beyond conventional learning environments and places of study because informal learning is becoming a more significant construction in educative processes (ibid, p1) - that is for example, through communities of practice, social (learning) networks, open access to data and information repositories, work-based and experience-creditable learning and indeed, MOOCs. Significantly, connectivism is seen by some to be particularly influential in reshaping higher education for the future consumers of its products (Marais, 2011), into what is now being considered as a sociotechnical context of learning (Bell, 2011). However as with all emerging theories, critics argue that this new theory is unlikely to be the theory that explains how learning absorbs, transforms and creates knowledge, even in the new learning environments of e-learning (Goldie, 2016), because fresh ideas take time to be consolidated through critical evaluation and observation of practice, principally through research. Nonetheless, connectivism is winning advocates to its cause and may be highly attractive to learning providers where, in an uncertain financial climate, many of the costs associated with curriculum delivery are claimed to be significantly reduced (Moonen, 2001) albeit as a result of initial investment in developing and installing new technology systems.
An overview of social cognitive theory
The core of social cognitive theory is about explaining human behaviour in the context of systems of self-regulation. Bandura argues that these systems are the major influences that cause our actions and behaviours. Emanating from his earliest writings, the principal idea is enshrined by a model of triadic reciprocal causation where the three interacting factors of personal influences, the environment, and action-feedback-reaction mechanisms that are integrated into all human behaviours, act reciprocally and interactively as a structure that constitutes what is human agency – that is, the capacity for individuals to act independently and achieve outcomes through purposive behavioural actions. In this theory, individuals are neither entirely autonomous agents of their own behaviour nor are they solely actors in reactive actions that are driven by environmental influences (Bandura, 1989). More so, it is the interactions between the three factors that are thought to make a significant causal contribution to individuals’ motivations and actions. The graphic below illustrates the interrelationships between the three factors in the triadic reciprocal causation model and suggests many of the sub-components of each the factors:
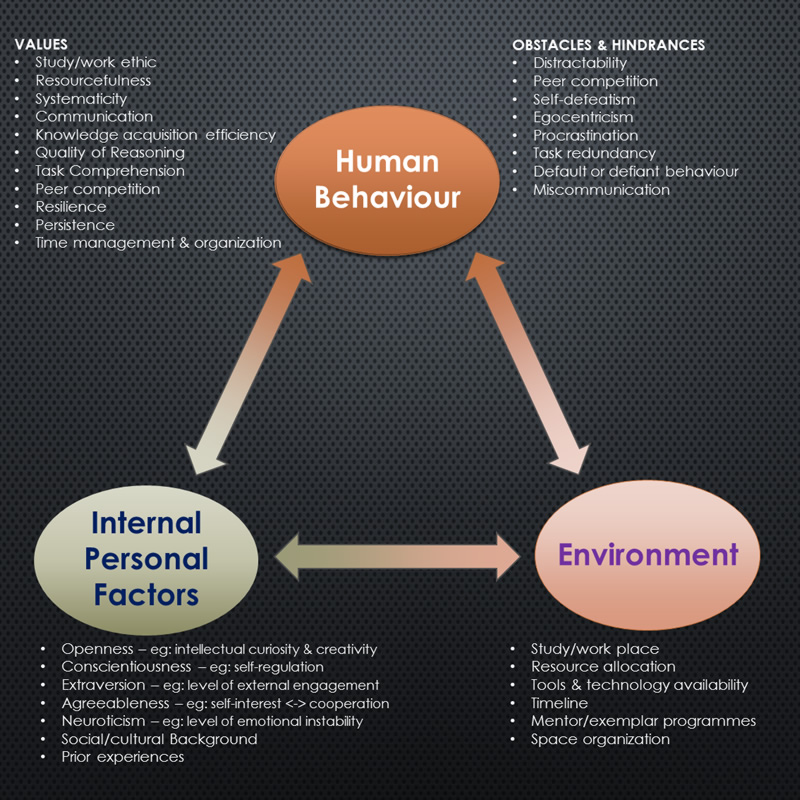
[ adapted variously from Bandura, 1977, 1982, 1989, 1991, 1997 ]
Much of these are tied up with forethought based on past experiences and other influences - many of these being external - that precedes purposive action. This is to say that within the context of belief-systems, goal-setting and motivation, we all plan courses of action through tasks and activities that are designed to result in outcomes. None of our actions nor behaviour is random, despite evidence in earlier theories to the contrary which appeared to have demonstrated that such random behaviours are externally modifiable through stimuli of one form or another (eg: Skinner, 1953) or as more casually observed through the apparently variable and unpredictable nature of human behaviour. By thinking about future events in the present, motivators, incentives and regulators of behaviour are developed and applied. Bandura constructs his theory of the self-regulative processes around three core concepts: that of self-observation, judgemental processes, and self-reaction. Although a linearity is implied, these concepts are more likely to operate in a cyclical, feedback loop so that future behaviour draws on lessons learned from experiences gained in the past, both directly and through more circuitous processes, as we will see below.
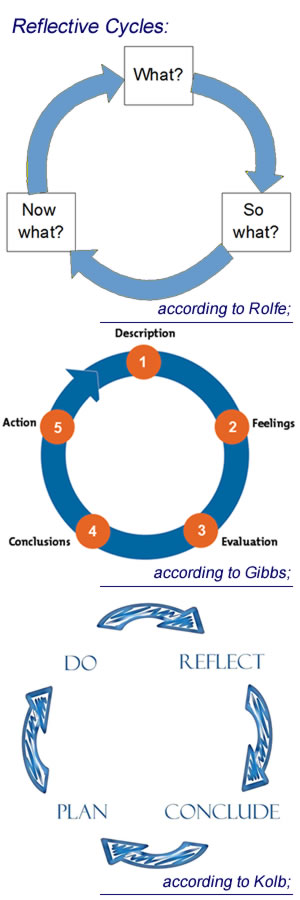 Key to self-observation is the self-reflective process: in order to influence our own motivations and actions we need to reflect on past performances. This is especially important in learning contexts and has been established as an important guiding principle in the blend of formal and independent learning processes that constitute the curriculum delivery at university in particular, where ‘reflective cycles’ are prevalent in numerous academic disciplines. This is especially so in ones that involve an element of practice development such as nursing and teaching (eg: Wilson, 1996, Pelliccione & Raison, 2009). But the self-diagnostic function can be very important per se, not least because for those who are able and motivated to respond to the information acquired by reflective self-monitoring, behavioural change and/or modification of the respective environment, the potential for improving learning quality can be a valuable outcome (Lew & Schmidt, 2011, Joseph, 2009). At university, this translates into students becoming more capable at making immediate and adaptive changes to their learning and study strategies to displace sometimes deeply entrenched surface- or ‘non-learning’ inertia and hence, change outcomes (Kinchin, 2008, Hay, 2007) and although may possibly lead to elements of academic dishonesty (Hei Wan et al, 2003), it is more likely that proactive learning innovations will bring higher academic rewards.
However, being self-judgemental can be challenging, especially when doing so has a bearing on perceptions of personal competence and self-esteem because affective reactions (that is, ones that are characterized by emotions) that may be activated can distort self-perceptions both at the time and also during later recollections of a behaviour (Bandura, 1993). But this does not alter the fact that observing one’s own pattern of behaviour is the first of a series of actions that can work towards changing it (ibid). First and foremost is making judgements about one’s own performance relative to standards, which can range from external assessment criteria to those collectively set by social and peer-group influences (Ryan, 2000) where the objective is to establish one’s personal standards with reference to the standards of the comparison group. Even within the framework of absolute standards that are set externally, social comparison has still been show to be a major factor that individuals refer to for judging their own performance although these judgements can vary depending on which social comparison network is chosen (Bandura & Jourden, 1991). This seems likely to be highly significant in education contexts and might be taken to indicate that teacher-tutor efforts at raising the achievement standards of individual students should also be applied to the student’s immediate learning-peer-group, the outcome of which would be shared improvement throughout the group which should carry with it the desired improvement of the individual.
But another significant factor that influences self-judgemental processes is the value that individuals attach to the activity that they are engaged in. Bandura (1991) tells us that, not unsurprisingly, individuals are less likely to engage positively with activities that they consider not important to them than with those that are viewed as valuable – for whatever reason – or which may have a significant impact on their futures. This is often challenging in compulsory education where adolescents in particular, tend to be very critical of the value of much of the curriculum learning that they are compelled to engage with (Thuen & Bru, 2000, Fabry, 2010). Not least this is because nationally-imposed curricula remain focused on conveying content to the detriment of developing thoughtful learners (Wiggins & McTighe, 2008), although some evidence shows that teachers who choose to adopt a more dialectic, rather than didactic approach to engaging with teenagers tend to be more successful in overcoming these teaching challenges (Cullingworth, 2014). A legacy of this reluctance to positively participate in learning structures, especially ones that adopt a conventional approach to the delivery of the curriculum, has been found to extend into tertiary level learning (Redfield, 2012) despite the greater degree of individualized self-learning management that exists in university learning structures where it would be expected that students who have chosen to study in a particular discipline are positively inclined to engage with it.
Performance judgements pave the way towards the last of Bandura’s three core components, that of self-reaction which, we learn, is the process by which standards regulate courses of action. This is about the way in which we integrate our personal standards into incentivisation or self-censure which is mostly driven by motivation levels based on accomplishment and the affective reactions to the degree to which success (or not) measures up to our internalized standards and expectations. In many domains of functioning there is abundant research to support the well-used cliché, ‘success breeds success’ with plenty of this in learning contexts: for example evidence has been found in university-industry learning-experience initiatives (Santoro, 2000), in mathematics teaching and learning (Smith, 2000), or in knowledge management and more business-oriented settings (Jennex, et al, 2009, Roth et al, 1994) with all of these studies reporting in one form or another, the positive impact of early- or first-initiative success on later-action success. Zimmerman (1989) reports that one of the most significant factors that differentiates between those who are successful in responding to their self-regulatory efforts and those who are not, is the effective utilization of self-incentives. We might imagine that this may be no-better illustrated than in the writing habits of PhD students who must depend on their own writing self-discipline because there is a much reduced supervisory element at this level of study in comparison to lower degrees. Hence developing writing incentives as part of the study-research process becomes instrumental to a successful outcome, with the most accomplished doctoral students likely to have developed the expected high-level study strategies early on. Indeed, there is now evidence to report that the process of ‘blogging’ as a means to provide writing incentives to university students is reaping positive benefits not least as online, personal study journals are likely to encourage extra-individual participation and self-reflection, and subsequently increase writing fluency (Zhang, 2009).
Thus the three-component structure of social cognitive theory has been briefly prequelled with particular attention being paid to its relationship to education and learning by providing examples about how the application of SCT might fit into learning and teaching contexts. But the functional operation of SCT now needs discussing and specifically, the construct of self-efficacy (and human self-efficacy beliefs) which is a key determiner that influences individuals’ choices about courses of action, how much effort they invest in them, their level of persistence and determination – especially in the face of adversity or setbacks – and the ways in which their thought patterns contribute positively or only serve to impede their progress.
Self-efficacy in social cognitive theory and in learning
Based on much of his earlier work developing Social Cognitive Theory, Bandura turned his attention to the application of SCT to learning. The seminal work on self-efficacy (Bandura, 1997) has underpinned a substantial body of subsequent research in the areas of behavioural psychology and social learning theory, especially in relation to the roles that self-efficacy plays in shaping our thoughts and actions in learning environments. Self-efficacy is all about the beliefs we have and the judgements we make about our personal capabilities and these are the core factors of human agency, where the power to originate actions for given purposes is the key feature (ibid, p3). Our self-efficacy beliefs contribute to the ways in which self-regulatory mechanisms control and influence our plans and actions, and hence, the outcomes that are the results of them. Bandura’s arguments and theses about how self-efficacy impacts on effort, motivation, goal-setting, task value, task interest and task enjoyment can be usefully distilled into 9 key points, additionally supported through the work of other researchers as cited. All of these points are highly pertinent in the domain of learning and teaching:
- Individuals with a strong self-efficacy belief will generally attribute task failures to a lack of effort whereas those with much lower levels of self-efficacy ascribe their lack of success to a lack of ability (Collins, 1982);
- Changes in self-efficacy beliefs have a mediating effect on the ways in which individuals offer explanations related to their motivation and performance attainments (Schunk & Gunn, 1986);
- Self-efficacy beliefs also mediate the ways in which social comparisons impact on performance attainments (Bandura & Jourden, 1991);
- Those who judge themselves to be more capable tend to set themselves higher goals and demonstrate greater commitment to remain focused on them (Locke & Latham, 1990);
- Self-doubters are easily deterred from persisting towards goals by difficulties, challenges and failures (Bandura, 1991);
- Conversely (to 5), self-assurance breeds an intensification of effort in the face of adversity or failure and brings with this, greater persistence towards success (Bandura & Cervone, 1986);
- Self-efficacy makes a strong contribution towards the ways in which individuals ascribe value to the things they attempt (Bandura, 1991);
- Individuals who present high levels of self-efficacy beliefs are more prone to remain interested in tasks or activities, especially ones from which they gain satisfaction by completing them and which enable them to master challenges (Bandura & Schunk, 1981);
- Deep immersion in, and enjoyment of pursuits and challenges tend to be best maintained when these tasks are aligned with one’s capability beliefs, especially when success contributes towards aspirations (Csikszentmihalyi, 1979, Malone, 1981);
Thus, self-efficacy is broadly about judging one’s capabilities to get something done and is integrated into many of the self-regulatory mechanisms that enable and facilitate the processes we need to engage in to accomplish things. That is, it is a construct that has functional characteristics and is a conduit for competencies and skills that enable positive outcomes. A function is a determinable mapping from one variable to a related dependent one, hence it is reasonable to suppose that outcome is a dependent function of self-efficacy, and that (academic) self-efficacy belief can be a dependent function of aptitude (Schunk, 1989). This idea now moves the discussion forward a little and might be illustrated in the context of a typical, university, academic example:
- “Once I’ve got started on this essay about the role of mitochondria in cell energy factories I’m confident that I can make a pretty good job of it and finish it in time for the deadline”
This student is expressing a strong measure of self-efficacy belief in relation to this essay-writing task and we should notice that self-efficacy is domain (context) specific (eg: Wilson et al, 2007, Jungert et al, 2014, Uitto, 2014). Task and domain specificity is considered in more detail below. For our science student, the challenges of the task have been considered and the evaluation integrated with perceived capabilities – in this case, capabilities about writing an academic essay based on scientific knowledge. Whereas outcome can be more obviously considered as a function of self-efficacy, conversely, self-efficacy belief may also be a function of outcome expectations because the essay writing task has not yet commenced or at least certainly is not completed. The student is projecting a belief about how successful the outcome will be for some point in the future and so it is reasonable to suppose that this may have an impact on the ways in which the task is approached and accomplished. This is an important point, however the bidirectionality of the functional relationship between self-efficacy beliefs and outcome expectations is not altogether clear in Bandura’s writings. In an early paper it is argued that Social Cognitive Theory offers a distinction between efficacy expectations and outcome expectancy:
- “An efficacy expectation is a judgement of one’s ability to execute a certain behaviour pattern, whereas an outcome expectation is a judgement of the likely consequences such behaviour will produce” (Bandura, 1978, p240).
By including the phrase ‘likely consequences‘ Bandura’s statement seems to be indicating that a self-efficacy belief precedes an outcome expectation and although these concepts seem quite similar they are not synonymous. For example, a student who presents a strong belief in her capacity to learn a foreign language (which is self-efficacy) may nevertheless doubt her ability to succeed (an outcome expectation) because it may be that her language class is frequently upset by disruptive peers (Schunk & Pajares, 2001) and this conforms to the correct sequential process implied in the statement above. The key idea according to Bandura and others such as Schunk and Pajares – who broadly take a similar standpoint to Bandura although acknowledge that the relationships between self-efficacy beliefs and outcome expectancy is far from straightforward – is that beliefs about the potential outcomes of a behaviour only become significant after the individual has formed a belief about their capability to execute the behaviour likely to be required to generate the outcomes (Shell et al, 1989) and that this is suggested to be a unidirectional process – that is, it can not occur the other way around. This is important because it implies that self-efficacy beliefs causally influence outcome expectancy rather than proposes a bidirectional, perhaps more associative relationship between the constructs, or that there are circumstances when they may be mutually influential. Bandura provides a useful practical analogy to argue the point that self-efficacy beliefs more generally precede outcome expectations:
- "People do not judge that they will drown if they jump into deep water and then infer that they must be poor swimmers. Rather, people who judge themselves to be poor swimmers will visualize themselves drowning if they jump into deep water" (1997, p21).
which is also demonstrated in a simple schematic presenting the conditional relationships between self-efficacy beliefs and outcome expectancies as Bandura sees it (adapted from 1997, p22)
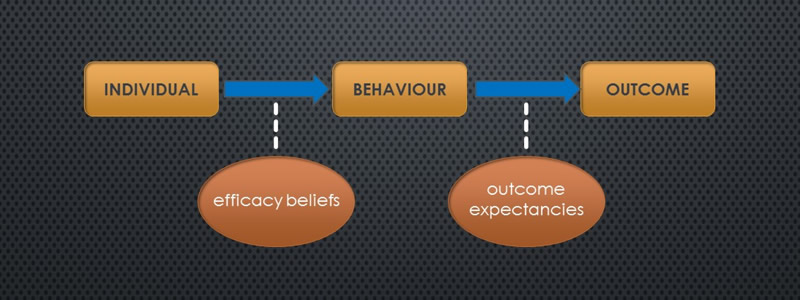
However, a wider review of literature shows that the evidence is conflicting, to start with because definitions of construct parameters are not universally agreed. In trying to establish exactly what is meant by an individual’s self-efficacy beliefs, understanding is clouded because the key parameter of ‘capability’, widely used in research definitions, must be relative to the domain of interest but is also necessarily subjective, based on the individual’s perception of their capability in that context. Thus, even in an experiment with a clearly defined outcome that seeks to find out more about participants’ context-based self-efficacy beliefs and their task outcome expectancy, the variability between participating individuals’ perceptions of their capabilities, even in the same context, would be very difficult to control or objectively measure because these are ungradable, personal attributes formed through the incorporation of a diversity of individualized factors ranging from social, peer-group and family influences (Juang & Silvereisen, 2002) to academic feedback reinforcement which can be both positive and negative (Wilson & Lizzio, 2008).
 Of the numerous studies found so far, ‘capability’ is almost universally used in an undefined way with the assumption made that its non-absolute variability is accommodated into the research methodology of the study on the basis of a tacit understanding about what it means. For example Bong, who has contributed substantially to the debate about the position of self-efficacy beliefs in learning situations, conducted several studies exploring academic self-efficacy judgements of adolescent and college learners. The general objectives were to reveal more about the context-specific versus generalized nature of the construct, or how personal factors such as gender or ethnicity affect self-efficacy judgements (Bong, 1997a, 1997b, 1998a, 1998b, 1998c, 2001, 2002), all of which relied on Bandura’s model as the underpinning theory to the research. In keeping with Bandura’s definitions of self-efficacy (previously cited) ‘capability’ was used throughout these studies, with perceived capability being specifically measured by gauging research participants’ judgments of their assuredness about solving academic tasks. But nowhere was to be found a meaningful definition of ‘capability’ with studies relying on readers’ understanding of ‘capability’, presumably contextualized into the nature of the research. To further illustrate the point that ‘capability’ should be not be left undefined, one other particularly interesting study provided some participants with a short contextual overview to aid their perception of ‘capability’ whereas others were not, and the research outcome subsequently showed that self-efficacy ratings were highly influenced by the way in which the notion of ‘capability’ was presented, or indeed, if not exemplified at all (Cahill et al, 2006). This appears to be a typical feature in the literature and is painting ‘capability’ as a kind of threshold concept (Meyer & Rand, 2003, Irvine & Carmichael, 2012, Walker, 2012) much like ‘irony’, where pinning down a meaning is elusive and rather, depends on the acquisition of a sense of the term through multiple, contextualized examples. Perhaps we have to live with this kind of definition uncertainty but it remains unsettling for the researcher because surely science prefers ground rules and definitions when scoping out and conducting research as opposed to building a study on a foundation of intangibles. An analogy might be the reliance on ‘similar case evidence’ such that the legal profession are known to employ to attempt to prosecute a case in the absence of facts and witness statements, which may as equally leave a jury uncomfortable in reaching a verdict as it might the scientist about the outcome of a study. Nevertheless, working with difficult-to-define concepts and constructs appears to be the status quo for research in the social sciences and in this study, working with ‘undefinables’ is one of the limitations that is important to identify.
Thus the literature shows that many researchers keen to exploit Bandura’s Social Cognitive Theory to support the design and methodologies of their studies may not have paid sufficient attention to this problem of operational definitioning by taking the theory ‘as read’ and without the adoption of a more objective standpoint or stating clearly their perspective. For example, Riggs et al (1994) applied the self-efficacy and outcome expectancy dimensions of SCT to find out more about attitudes to work in an occupational setting. Their study is a pertinent example of one that appears to be grounded in weak conceptual foundations, firstly because a reluctance to properly gain a grasp of the background understanding is perhaps evidenced because the evaluation scales developed were said to rely on ‘scrutin[y] by two “expert judges” with Ph.D degrees who had a knowledge of both measurement theory and Bandura’s theories‘ (ibid, p795); and secondly because the main focus of the study was to develop such evaluation scales based on the premise that self-efficacy and outcome expectancy are discrete constructs – which they cited as a central tenet of Bandura’s theory but without a discussion about Bandura’s key claim that self-efficacy beliefs unidirectionally influence outcome expectancy. In their scales, various characteristics of workers’ approaches to the demands of their occupations were supposedly determined – characteristics such as work satisfaction, organizational commitment and work performance – and although their scales were claimed to exhibit good reliability, any discussion about the likely, or at least possible, mutually influential interrelationships between self-efficacy and outcome expectancy was not evident, rather, offered an acknowledgement that the conclusion to the study remained disappointing and put this down to their results nevertheless being at least consistent with ‘the reality that performance is determined by many factors’ (ibid, p801). In the light of several earlier and contemporary studies which indicated that the causal unidirectionality was beginning to be challenged (see below) that had emerged between Bandura’s original thesis (1977) and Riggs’ research, it is a weakness in Riggs’ study for this not be considered as a factor which may have led to their ‘disappointing results’. Nevertheless, the four scales that their study developed, respectively measuring Personal Efficacy (PE), Personal Outcome Expectancy (POE), Collective Efficacy (CE) and Collective Outcome Expectancy (COE), do at least provide an insight into their interpretations of the interrelationships between self-efficacy and outcome expectancy in the context of an occupational setting (view the scales here) and their study’s factor analysis of the scales is claimed to support their understanding about Bandura’s early contention that self-efficacy beliefs and outcome expectancies are discrete constructs.
 More disconcerting, is the evidence from several studies which appear to expose a deeper flaw in Bandura’s key argument, concisely summarized by Williams (2010), who seemed equally unsettled by the blind adoption of theory as fact rather than being guided by the spirit of scientific research based on nullius in verba. In his paper (ibid), a case was built through the examination and citation of several examples of research which countered Bandura’s ‘fact’ that self-efficacy beliefs causally influence outcome expectancies in that direction only. Williams summarizes an argument about the causality of self-efficacy beliefs on behaviour that has remained unresolved for three decades, particularly through use of extensive research by Kirsch amongst notable others, which explored the impacts that incentivizing outcome expectancy has on perceptions of capability, that is, self-efficacy beliefs. Williams re-ignited the debate on whether or not self-efficacy beliefs can be attributed as a cause for behaviour without being influenced by expectations of possible outcomes that will result from the behaviour, or even that the complete process can just as likely occur the other way around.
 Kirsch’s (1982) bizarre studies involved enticing participants to approach a (harmless) snake in comparison to them engaging in a mundane and trivial skills exercise. The study clearly demonstrated that by using financial incentives, participants raised their levels of self-efficacy beliefs for both activities but more so for approaching the snake. This indicated that outcome expectancies can influence self-efficacy beliefs. Of particular interest in that research were the conclusions that efficacy ratings may take different values depending on whether they are in relation to non-aversive skills tasks or to tasks related to feared stimulus (ibid, p136). The key point is that for trivial or skills-based tasks, belief in an ability to accomplish them appears fairly fixed and not likely to be altered through incentivizing the tasks – individuals simply stick to the belief about what they are capable of – whereas tasks that are not reliant on a specific skill and particularly those which hold aversion characteristics, i.e. approaching a snake, individuals exhibit efficacy beliefs which can be modified through the offer of incentives because they are tasks that invoke (or not) willingness rather than ability. This is the significant point because ‘willingness’ is driven by an outcome expectancy whereas ability is driven by a self-efficacy belief. Hence Kirsh has shown that the causality linkage between self-efficacy beliefs and outcome expectancy is bidirectional in some circumstances. Similar findings were reported in other research domains, notably in relation to smoking cessation (Corcoran & Rutledge, 1989) and also where actual monetary gains were offered to induce college students to endure longer exposure to pain which, through the randomized nature of the actual rewards, showed that the impact of expected financial gain influenced self-efficacy (Baker & Kirsch, 1991). Indeed, Bandura’s interest in how efficacy beliefs are of a different flavour when associated with aversive or phobic behaviours is evidenced in studies in which his input is apparent, notably in domains which explore the impact on efficacy beliefs of therapeutic treatments proposed for the amelioration of such behaviours (eg: Bandura et al, 1982).
 Hence, it seems reasonable to suppose that similar relationships may occur in other domains. To put this into a more recent context in university learning, we might reflect on the increasing prevalence of incentivizations that institutions are widely adopting to encourage attendance in the light of aversion to debt resulting from fees increases across the sector in the UK in the last decade. It is of note that the very socio-economic groups targeted by governments as desirable to encourage into university learning through widening participation initiatives, tend to be the most debt-averse and the least likely to have this aversion mediated through financial incentivization (Pennel & West, 2005, Bowers-Brown, 2006) – hence this may be one explanation for the continuing (albeit small) decline in student numbers in UK universities, especially for undergraduates and which is independent to demographic variations in cohort (UCAS, 2017). Indeed, Bandura tells us that ‘people who doubt they can cope effectively with potentially aversive situations approach them anxiously and conjure up possible injurious consequences‘ (1983, p464). For contemporary students, this may be the lasting legacy of substantial student debt and the consequences they perceive this may have on their later lives. Conversely, for those who anticipate an abilty to exercise control over their later financial circumstances and consider the benefits of higher education to outweigh the negative consequences of later debt, aversion towards high student fees and loans are mediated.
We are therefore left with two uncertainties when seeking to use the principles of self-efficacy beliefs to explain individuals’ behaviour: the first is that operational definitions of attributes and characteristics of self-efficacy are difficult to firmly establish, particularly the notion of ‘capability’; and secondly that Bandura’s underlying theory appears not quite as concrete as many researchers may have assumed and despite Bandura’s numerous papers persistently refuting challenges (eg: Bandura, 1983, 1984, 1995, 2007) it seems clear that care must be exercised in using the theory as the backbone of a study if the outcomes of the research are to be meaningfully interpreted in relation to their theoretical basis. In particular, there seems some inconsistency about the operational validity of the self-efficacy<->outcome expectancy relationship in some circumstances, notely ones that may involve attributing the functional relationships between the two constructs into phobic behaviour situations where self-efficacy measures of (cap)ability are obfuscated by the related but distinct construct of willingness (Cahill et al, 2006). Given elements of phobic behaviour observed and researched in the domain of education and learning (eg: school phobias; for some useful summaries see: Goldstein et al, 2003, King et al, 2001, Kearney et al, 2004), consideration of this facet of self-efficacy belief theory to learning contexts should not be neglected.
In summary, it is useful to compare the schematic above (taken from Bandura, 1997, p22) which illustrates the unidirectional relationship from self-efficacy to outcome expectancies with the the schematic here, modified into our context based on a prior adaption (Williams, 2010, p420) of Bandura’s writings in the same volume (op cit, p43) which apparently suggests that a reversed causality direction can occur.
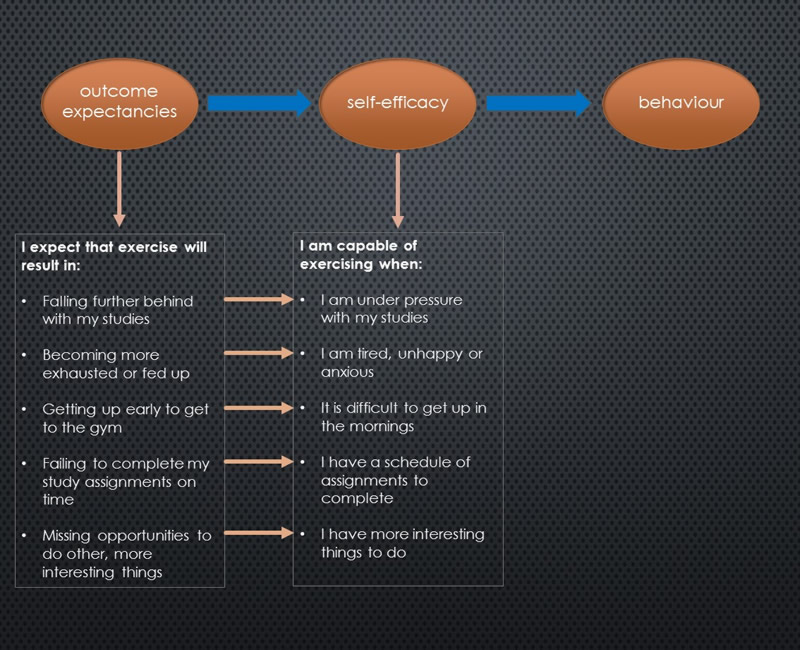
Dimensions of self-efficacy - level/magnitude, strength, generality
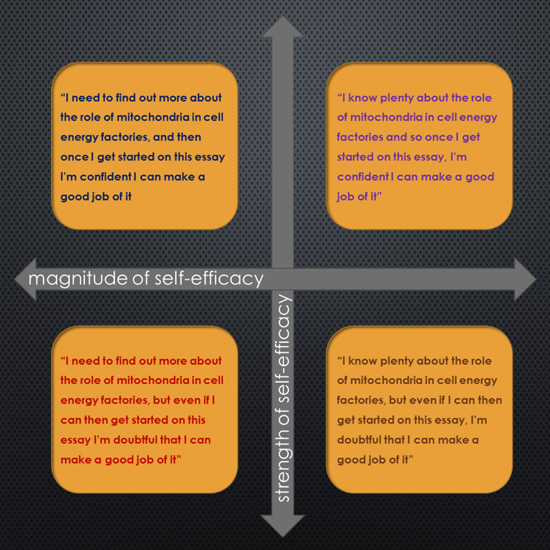
Efficacy beliefs in the functional relationship that link self-efficacy through behaviour to outcome expectations (and sometimes reciprocally as we have discussed above) have been shown through a wide body of literature supporting Bandura’s central tenets to be componential and we can think of the level or magnitude of self-efficacy expectations and the strength of self-efficacy expectations as the two primary dimensions. (Stajkovic, 1998). Magnitude is about task difficulty and strength is the judgment about the magnitude: a strong self-efficacy expectation will present perseverance in the face of adversity whilst the converse, weak expectation is one that is easily questioned and especially doubted in the face of challenges that are thought of as difficult, (a sense established above in points 5 and 6). Bandura referred to magnitude and level synonymously and either term is widely found in the literature.
- MAGNITUDE: ‘whether you believe that you are capable or not …’
- STRENGTH: ‘how certain (confident) you are …’
The essay-writing example used earlier demonstrates an instance of the capacity to self-influence, and in learning challenges the ways in which an individual reacts to the challenges of an academic task is suggested to be a function of the self-efficacy beliefs that regulate motivation. It also provides an example of academic goal-setting – in this case, meeting the deadline – to which motivation, as another significant self-regulator mediated by self-efficacy, is a strong impacting factor, and to which significant associations between academic goal-setting and academic performance have been demonstrated (Travers et al, 2013, Morisano & Locke, 2012). However, expanding on this is for a later discussion although the graphic below serves to illustrate how the dimensions of magnitude and strength might be working in relation to the example-task of writing an academic essay. Each quadrant provides a suggestion about how a student might be thinking when approaching this essay-writing task and are related in terms of their levels of perceived capability (magnitude) and confidence (strength) as dimensions of their academic self-efficacy beliefs.
In his original paper (1977) Bandura set out the scope and self-efficacy dimensions of magnitude and strength, and also the third dimension, ‘generality’ which relates to how self-efficacy beliefs are contextually specific or more widely attributable. The paragraph in this paper which provides a broad overview is presented verbatim (below) because it is considered useful to observe how confounding this earliest exposition is, and hence to reflect on how Bandura’s original thesis may have confused subsequent researchers due to the interchangeability of terms, words and phrases that later had to be unpicked and more precisely pinned down:
‘Efficacy expectations vary on several dimensions that have important performance implications. They differ in magnitude. Thus when tasks are ordered in level of difficulty, the efficacy expectations of different individuals may be limited to the simpler tasks, extend to moderately difficult ones, or include even the most taxing performances. Efficacy expectations also differ in generality. Some experiences create circumscribed mastery expectations. Others instill a more generalized sense of efficacy that extends well beyond the specific treatment situation. In addition, expectancies vary in strength. Weak expectations are easily extinguishable by disconfirming experiences, whereas individuals who possess strong expectations of mastery will persevere in their coping efforts despite disconfirming experiences.’
Bandura, 1977, p194
As an aside to trying to gain a clearer understanding of the message about level, strength and generality, it is of note that in this earliest of his writings on his theme, Bandura somewhat offhandedly speaks of ‘expectations’ which, in the light of the points made earlier, would be discomfiting were it not for later, clearer theses which relate the term to outcomes, with ‘efficacy expectations‘ being subsequently referred to as ‘perceived self-efficacy’ and ‘self-efficacy beliefs‘ – altogether more comprehensible terms. Indeed, in a later paper (1982) the phrase ‘efficacy expectations’ occurred just once and was used in referring to changes in efficacy through vicarious experiences (more of this below). By the time of this paper, Bandura’s discursive focus had sharpened with the result that the ideas were less confusing for the researcher, easier to understand and more appropriately applicable.
Task / domain specificity
 To follow through from our student facing a challenging essay-writing task it should be noted that self-efficacy is not necessarily a global construct and tends to be task-specific (Stakjovic, 1998). Our student may think herself perfectly capable in essay-writing, but consider that arguing the key points to peers through a group presentation quite beyond her. Taking another example outside the environment of learning and teaching: In the domain of entrepreneurship and risk-taking, the sub-construct of entrepreneurial self-efficacy (ESE) was proposed as part of the research hypothesis in a study to explore decision-making in relation to the opportunities or threats presented in test dilemmas. Results supported the idea of entrepreneurial self-efficacy as a relevant, task-specific construct by indicating that decision-making based on higher levels of ESE were more opportunistic and had a lower regard for outcome threat (Kreuger & Dickson, 1994). A later study, also using ESE, generated research results which, it was claimed, established entrepreneurial self-efficacy as a distinct characteristic of the entrepreneur in relation to individuals operating in other business or management sub-domains and that it could be conversely used to predict the likelihood of an individual being strong in the specific traits observed as part of the profile of successful entrepreneurs (Chen et al, 1998). In moving closer towards an educational domain, at least in terms of the research datapool, Rooney & Osipow (1992) further tested a ‘Task-Specific Occupational Self-Efficacy Scale’ (TSOSS), previously developed in an earlier study, using a sample of psychology and journalism undergraduates (n=201) to explore its applicability to career development and career decision-making. Underpinned by prior research which measured occupational or career self-efficacy, the outcomes of their study supported the task-specificity of self-efficacy although admitted the emergence of measurable differences between what they termed ‘general’ occupational self-efficacy and task-specific sub-components derived through their TSOSS. This was apparent through results from a datagroup which presented high self-efficacy for a particular general occupation but presented low self-efficacy in relation to some of the associated sub-tasks of that occupation – for example, some males in their sample believed that they could perform the occupation of social worker but not complete the sub-tasks associated with the domain of social work very effectively. Although these examples seem confounding, one aspect that emerges is that there appears to be a need to distinguish between a self-efficacy measure that is adopted to gauge self-efficacy beliefs in a general domain to those related to specific tasks within that domain. Hence our essay-writing student may present low self-efficacy beliefs related to the specific task of writing about the behaviour of mitochondria in cell energy factories, but be more effficacious when caused to reflect about studying more generally on her biological sciences course.
And so it is apparent that the self-efficacy component of Bandura’s Social Cognitive Theory has been tested in a variety of domains. Aside from those described above, it has been applied in university athletics to explore aspects of training commitment and motivation (Cunningham & Mahoney, 2004), in sport more generally in relation to competitive orientation and sport-confidence (eg: Martin & Gill, 1991), in music performance anxiety, (Sinden, 1999), in health studies to explore outcome expectations of diabetes management (eg: Iannotti et al, 2006), and investigating alcohol misuse in college students (Oei & Morawska, 2004) amongst a plethora of other study foci. However, the particular interest of this project is with self-efficacy in an educational context – academic self-efficacy – and this is discussed in more detail below.
Thus even though the wealth of research evidence supports the domain specificity of self-efficacy and indeed within that, elements of task-specificity, an element of generality is apparent and it is worth mentioning as a closing remark to this section that some researchers have persisted in attempting to take a more generalist viewpoint on self-efficacy. Schwarzer & Jerusalem (1995) developed a General Self-Efficacy Scale which attracted further development and spawned validation studies by the originators and others throughout the following two decades (eg: Bosscher & Smit, 1998, Chen et al, 2001, Schwarzer & Jerusalem, 2010). An example of how it has been used is demonstrated by an extensive, cross-domain and cross-cultural investigation which, through a meta-analytic validation study, claimed general self-efficacy to be a universal construct and that it could be used in conjunction with other psychological constructs meaningfully (Luszczynska et al, 2004), and an even more comprehensive meta-analysis using data from over 19,000 participants living in 25 countries which also suggested the globality of the underlying construct ( Scholz et al, 2002). Bandura has consistently doubted the veracity of research results which, he claims, misinterpret self-efficacy as a clear, narrow-in-scope construct and which hence try to justify the existence of a decontextualized global measure of self-efficacy, especially citing the lack of predictive (for behaviour) capability that is weak when using a global measure as opposed to a specifically-constructed, domain-related evaluation, and that this ‘trait’ view of self-efficacy is thin on explanations about how the range of diverse, specific self-efficacies are factor-loaded and integrated into a generalized whole (Bandura, 2012, 2015).
Mediating processes
An appealing characteristic of self-efficacy theory is that it is strongly influenced by an individual’s cognitive processing of their learning experiences (Goldfried & Robins, 1982) and so in the field of human functioning, but in particular in learning processes, Bandura’s underlying arguments that efficacy beliefs are core regulators of the way we interact and engage with learning opportunities and challenges are weighty and robust. His theories are supported by a plenty of research providing evidence that the process by which efficacy beliefs shape our learning is most strongly influenced by four, intervening agencies which he describes as ‘mediating processes‘, and which although may be of individual interest, are processes which operate mutually rather than in isolation (Bandura, 1997). In this context ‘mediating’ means where the action of a variable or variables affect, or have an impact on the processes that connect ourselves with our actions – in this case, our learning behaviour.
Bandura distills these these mediating processes into four components:
- cognitive processes – where efficacy, that is, the capacity or power to produce a desired effect or action, and personal beliefs in it, are significant in enhancing or undermining performance;
- motivational processes – where in particular, that through integrating these with attribution theory, the focus of interest is with explaining causality. In this way, theoretical frameworks are constructed which can find reasons that set apart otherwise similarly placed individuals but who take different approaches to (learning) challenges: At one end of the spectrum is the individual who attributes success to their personal skills, expertise and capabilities, and failure principally to a lack of effort. This individual is more likely to accept the challenges of more difficult tasks and persist with them, even in the face of a lack of successful outcomes. Whereas at the other end is the individual who may be convinced that their success or failure is mainly due to circumstances outside their control and hence, generally believes there to be little point in pursuing difficult tasks where they perceive little chance of success.
- affective processes – which are mainly concerned with the impacts of feelings and emotions in regulating (learning) behaviour. Significantly, emotional states such as anxiety, stress and depression have been shown to be strong affectors.
- selective processes – where the interest is with how personal efficacy beliefs influence the types of ((social) learning) activities individuals choose to engage with and the reasons that underpin these choices.
However the most significant aspect of social cognitive theory when applied to a social construction of learning where academic self-efficacy is suggested to be one of the most important influential factors, are the four, principal sources of efficacy beliefs. Bandura (1997) identified these four source functions as: mastery experience; vicarious experience; verbal persuasion; and physiological and affective states:
Mastery experience is about successes won by building upon positive experiences gained through tackling events or undertakings, whether these be practical or physical, theoretical or cerebral. That is, experience gained through actual performance. But building a sense of efficacy through mastery experience is not about just applying off-the-peg, ‘coached’ behaviours, it appears to rely on acquiring cognitive processing, behavioural and self-regulatory skills that can enable an effective course of action to be executed and self-managed throughout the duration of an activity or life-action. For example, experience gained in essay-writing at university that steadily wins better grades for the student is likely to increase beliefs of academic self-efficacy – in essay-writing at least – whereas failures will lower them especially if these failures occur during the early stages of study and do not result from a lack of effort or extenuating external circumstances; academic self-efficacy is widely regarded as domain specific in that it must be considered as relational to the criterial task (Pajares, 1996). However, although experience successes and failures are powerful inducers, Bandura reminds us that it is the cognitive processing of feedback and diagnostic information that is the strongest affector of self-efficacy rather than the performances per se (op cit, p81). This is because many other factors affect performance, especially in academic contexts, relying on a plethora of other judgements about capability, not least perceptions of task difficulty or from revisiting an historical catalogue of past successes and failures, and so personal judgements about self-efficacy are incremental and especially, inferential (Schunk, 1991).
![]()
However our essay-writing student will have also formed a judgement of their own capabilities in relation to others in the class. In contrast to the absolutism of an exam mark gained through an assessment process where answers are either correct or not, many academic activities are perceived as a gauge of the attainment of one individual in relation to that of similar others. The influence that this has on the individual is vicarious experience and it is about gaining a sense of capability formed through comparison with others engaged in the same or a similar activity. As such, a vicarious experience is an indirect one, and even though generally regarded as less influential than mastery experiences, the processing of comparative information that is the essential part of vicarious experience may still have a strong influence on efficacy beliefs, especially when learners are uncertain about their own abilities, for whatever reason (Pajares, et al, 2007). A key aspect of vicarious experience is the process of ‘modelling’ by which an individual externalizes the outcome of the comparative processing into actions and behaviour that are aligned with the immediate comparative peer group. Thus for students engaging in learning activities of which they have limited experience, their efficacy beliefs can be influenced by the ways in which they perceive their peers to have achieved outcomes when working on similar tasks (Hutchison et al, 2006). In a sense, this is a kind of quasi-norming process by which an individual uses social comparison inference to view the attainments of ‘similar others’ as a diagnostic of one’s own capabilities. Hence, viewing similar others perform successfully is likely to be a factor in elevating self-efficacy, as equally the converse is likely to depress it. An element of self-persuasion acts to convince the individual that when others are able to successfully complete a task then a similar success will be their reward too. The influence of vicarious experience has been particularly observed in studies concerning the learning behaviours of children where although ‘influential adults’ are of course, powerful models for signalling behaviours, when ability is a constraint the influences induced by comparison with similar peers can be more impacting (Schunk et al, 1987). It is also interesting to note that in line with points raised above about the impact of technology on the domain of learning and the functioning of learners, the influence of social media on learning behaviour is now becoming more recognized and researched, particularly where the vicarious experiences gained through widespread use of social media networks amongst communities of learners in relation to their learning may be having an impact on academic outcomes, both positive and negative (Unachukwu & Emenike, 2016, Collis & Moonen, 2008).
An individual’s self-efficacy can also be developed as a consequence of the verbal persuasion of significant others who are relational to them. Verbal persuasion in the form of genuine and realistic encouragement from someone who is considered credible and convincing is likely to have a significant positive impact (Wood & Bandura, 1989). There is plenty of research to support the influence on self-efficacy of verbal persuasion as one of the factors of social cognitive theory with examples coming from a range of disparate fields: In management and accountancy, a work-integrated learning programme to prepare accountancy under-graduates for employment specifically focused on verbal persuasion as a key, participatory component of the course as a mechanism for enhancing self-efficacy. ‘Significant others’ comprised accounting professionals and industry representatives and the outcomes of the metric used to assess self-efficacy ‘before’ and ‘after’ showed verbal persuasion to have had a significant impact on the increased levels of self-efficacy observed in the participants of the programme (n=35) (Subramaniam & Freudenberg, 2007). In teacher-training, the sense of teaching (self)-efficacy has been found to have a strong influence on teaching behaviour (not unsurprisingly) which is especially significant in student-teachers as they develop their classroom competencies and where encouragement gained from positive feedback and guidance from more experienced colleagues positively impacts on teaching practice confidence (Tschannen-Moran & Woolfolk Hoy, 2002, Oh, 2010). And not least in sport where there are a plethora of studies reporting the positive impact that verbal persuasion has on self-efficacy beliefs either through motivating ‘team talks’ presented by trainers or coaches (eg: Samson, 2014, Zagorska & Guszkowska, 2014) but also through actions of ‘self-talk’ although one interesting study reported that the greatest elevations of self-efficacy, collective efficacy and performance indicators were with individuals who practised self-talk verbal persuasion that took the group’s capabilities as the focus (Son et al, 2011).
Somatic study is an enquiry that focuses individuals’ awareness holistically and is inclusive of associated physical and emotional needs and where decisions are influenced and informed by an intrinsic wisdom (Eddy, 2011). We understand ‘soma’ to mean in relation to the complete living body and in the context of behavioural regulation, it means a process of doing and being. This is especially distinct from cognitive regulation of actions and decision-making – hence Eddy’s attribution of somatic enquiry to dance. The connection here to Bandura’s work is that in forming judgements about capabilities, individuals’ physiological and affective statesare partially relied upon and Bandura proposes that whilst somatic indicators are more especially relevant in efficacy judgements about physical accomplishments – in physical exertion such as strenuous exercise for example - our corporeal state is the most significant gauge of achievement, (or not, depending on our level of fitness perhaps) and hence influences our predictive ability to forecast likely future capacity and potential for further improvement – the ways in which our physiology reacts to or anticipates situation-specific circumstances and how our emotions are interrelated with this are impacting factors on efficacy judgements. (Bandura, 1997).
 Many early research studies exist which explore the impact of affective states on learning – that is, how we are feeling whilst we are learning – especially following the publication of Bandura’s original paper about factors that drive and control self-regulation (1977) which kindled interest in how emotion influences learning. However some studies appeared oblivious of the significance of Bandura’s work but are of interest because they present a slightly different perspective on how emotions and affective states impact on behavior regulation. One interesting paper proposed a linkage system of ’emotion nodes’ that are each comprised of components that are connected to it by associative pointers such as autonomic reactions, verbal labels and expressive behaviours (Bower et al, 1981); the theory proposes that individuals’ memory patterns are likely to be more deeply engrained when ‘mood-congruency’ exists. For example, a literature student preparing for an exam may be more likely to be able to recall a significant quotation from Shakespeare’s ‘As You Like It’ if their affective state at the time of learning matches the mood expressed in the quotation.
It is clear to see how powerful this process might be in learning contexts, especially for exam revision, and could almost be interpreted as akin to Skinner’s conditioned-response theories of learning which gained such popular acclaim amongst contemporary educational psychologists and practitioners some decades since. More modern theories proposing means’ to enhance study skills continue to advocate the use of memory triggers as a highly effective technique for exam preparation, for example constructing hierarchical pattern systems or memory pyramids (Cottrell, 2013), and many are developments of study-principles rooted in the pre-technology age when assessment was more closely aligned with the effective recall of facts (Rowntree, 1998). Indeed, one of the most recent developments in relating affective states to learning and memory has resulted in an emotional prosthetic which, through a variety of ‘mood sensors’, it is claimed, allows users to reflect on their emotional states over a period of time (McDuff et al, 2012). This thesis originated in earlier work on multimodal affect recognition systems designed to predict student interest in learning environments (Kapoor & Picard, 2005), and hence connect emotions and mood to learning effectiveness. The ‘AffectAura’ product emerged out of this field of research and appears to have been available from the developers at Microsoft as a download for installation on a local PC or Mac, however no sign of its current availability has been found suggesting that it was a research project that was eventually deemed commercially unviable.
Bandura too was taken by the idea of ‘mood congruency’ to support the argument about how affective states are able to directly influence evaluative judgements, (1997, p112, referring to Schwartz & Clore, 1988). The most important idea is about how individuals use a perception of an emotional reaction to a task or activity rather than a recall of information about the activity itself as the mechanism through which an evaluation is formed. Hence, positive evaluations tend to be associated with ‘good moods’ and vice versa although it is the attribution of meaning to the associated affective state which can impart the greater impact on the evaluative judgement. For example, a student who is late for an exam may attribute increased heart rate and anxiety levels to their lateness rather than associate these feelings to prior concerns about performing well in the exam – which in this case could possibly be a positive contributor to the likelihood of the student gaining a better result! Of more significance is that where mood can be induced, as opposed to being temporally inherent, a respective positive or negative impact on efficacy beliefs can also be observed, indeed the greater the intensity of mood that is evoked, the more significant the impact on efficacy becomes: individuals induced to ‘feel good’ exhibit more positive perceptions towards task characteristics and claimed to feel more satisfied with their task outcomes (Kraiger et al, 1989) which implies enhanced efficacy beliefs. More interesting still, is that mood inducement is reported to have a more generalized effect on efficacy beliefs rather than be directly connected with the domain of functioning at the time of the mood inducement (Kavanagh & Bower, 1985) which is clearly highly relevant in teaching and learning environments.
Having said this, contradictory evidence does exist which suggests that in some situations, induced negative mood in fact increases standards for performance and judgements of performance capabilities because it lowers satisfaction with potential outcomes and hence, serves to raise standards (Cervone et al, 1994) – at least amongst the undergraduate students in that study. The argument proposed is that a consequence of negative mood was an evaluation that prospective outcomes would be lower and hence the level of performance that is judged as satisfactory, is raised, resulting in an outcome that is better than expected. In other words, make students miserable, they will try harder and hence get better results. A curious and surely dubious educational strategy to pursue. In any event, this, and other papers cited in this section are aligned with the idea of ‘affect-as-information’ the broad gist of which is that in general, individuals are more likely to more easily recall and focus on the positive aspects or outcomes of a task or activity when they are in a ‘good mood’ and equally more likely to experience the converse when their mood is more negative (Schwarz, 1989). In Bandura’s Social Cognitive Theory, the impact of affective state on perceived self-efficacy follows a similar contention: that success achieved under positive affectors engenders a higher level of perceived efficacy (1997).
Agency
In more recent writing, Bandura has taken an agentic perspective to develop social cognitive theory (Bandura, 2001) in which 'agency' is the embodiment of the essential characteristics of individuals' sense of purpose. Sen (1993) argues that agency is rooted in the concept of capability, which is described as the power and freedoms that individuals possess to enjoy being who they are and to engage in actions that they value and have reason to value. Hence in adopting this perspective the notion of capability becomes more crystalized as a tangible concept rather than as an elusive threshold one, as outlined above. Cross-embedded with capability is autonomy with both being dimensions of individualism against which most indicators of agency have been shown to have strong correlations (Chirkov et al, 2003) in the field of self-determination theory (Ryan & Deci, 2000). Capability and, to a lesser extent, autonomy have been shown to be key characteristics for successful independent and self-managed learners (Liu & Hongxiu, 2009, Granic et al, 2009), especially in higher education contexts where the concepts have been enshrined as guiding principles in establishing universities' aims and purpose, strongly endorsed by the Higher Education Academy some two decades ago (Stephenson, 1998). In this domain, Weaver (1982) laid down the early foundations of the 'capability approach' with strong arguments advocating the 6 Cs of capability - culture, comprehension, competence, communion, creativity, coping - that set to transform the nature and purpose of higher education away from the historically-grounded didactic transmission of knowledge to largely passive recipients through a kind of osmotic process, into the kind of interactive, student-centred university learning broadly observed throughout tertiary education today. Capable learners are creative as well as competent, they are adept at meta-learning, have high levels of self-efficacy and can adapt their capabilities to suit the familiar, varied or even unfamiliar activities, situations and circumstances in which they find themselves (Nagarajan & Prabhu, 2015).
In social cognitive theory, agency is where individuals produce experience as well as gain it, and as such shapes, regulates, configures or influences events that they engage in (Bandura 2000). It is viewed in terms of temporal factors embodying intentionality and forethought. These are deemed essential bases for planning, time-management and personal organization which are all elements of self-regulation that temper behaviour or are drivers of motivation in response to self-reactive influences. In particular, these are influences that guide or correct personal standards and foster introspective reflection about one's capabilities and the quality of their application in the self-examination of one's own functioning. Bandura advocates efficacy beliefs as the foundation of human agency (ibid, p10) and the most important idea is that three forms of agency are differentiated in social cognitive theory where each has a different influence on the behaviours and actions of individuals. Most of the theory and research centres around personal agency, with the focus being on how cognitive, emotional and affective processes, motivation, and choice all contribute towards shaping our actions. It is here that the key concept of self-efficacy belief is located, and, as outlined earlier, this construct is theorized as one of the drivers that influence our goals and aspirations, our feelings and emotions in relation to activities and behaviour, our outcome expectations and how we perceive and engage with difficulties, obstacles and opportunities encountered in our social sphere. In proxy agency, the second derivative of agency in social cognitive theory, the interest is with how individuals use influential 'others' to enable them to realise their outcome expectancies. This may be for one of three reasons: firstly, the individual does not consider that they have developed the means to reach the desired outcome; secondly, they believe that engaging someone to act on their behalf will see them more likely to achieve the outcome, or lastly, the individual does not want to, or does not feel able to take personal responsibility for direct control over the means to achieve the outcome. Proxy agency has been extensively observed in exercise research where numerous studies have evidenced the role of proxies in helping individuals manage the multiple self-regulatory behaviours that relate to continued adherence to exercise regimes (eg: Sheilds & Brawley, 2006,) and in industrial or institutional collective actions for example (Ludwig, 2014).
 Which leads neatly to the last form of agency, collective agency. Here, individuals act cohesively with a joint aim to achieve an outcome that is of benefit to all of them. This can be widely observed in the natural world where many animals work in swarms or in smaller groups together to strive towards a collective objective. In people, collective agency occurs extensively in group behaviour but most notably occurs in sport where it is a principle factor in effective team-working. Sometimes however, it can be observed that a collection of highly talented and skilled individuals - an example that comes to mind are some national football team in recent years - fail to bind together cohesively and cooperatively and hence, under-perform relative to both the individual expectations of the team members and indeed, their nations as a whole. Collective agency also occurs widely in the industrial or commercial workplace where unionized workforces collectively act towards, for example, improving working conditions and it can be seen that in this example in particular, a blend of proxy and collective agency operates to meet outcome expectancies. More pertinent to our domain of interest, collective agency is witnessed in schools where teachers' beliefs in their own teaching efficacy have been noted to contribute to a collective agency in the institution which progresses the school as a whole (Goddard et al, 2000, Goddard et al, 2004a). Indeed, some studies have reported that high collective efficacy in schools can generate a strongly positive, institutionally-based, embedded learning culture, which in turn can impact positively on student achievement (Hoy, et al, 2006, Bevel & Mitchell, 2012). This has led to the emergence of fresh education research pioneered by Goddard (eg: 2001, Goddard et al, 2004b) and notable others (eg: Tschannen-Moran et al, 2004) leading to more recent interest in promoting learning and teaching regimes that adopt a more collaborative approach between teachers and students in the classroom to foster higher levels of academic achievement (Moolenaar et al, 2012) and more particularly in exploring how the 'flipped classroom' can completely turn around the learning process to place students in positions of much greater control over the mechanisms that they may individually adopt to gain knowledge and which then utilizes the expertise and guidance of their teachers or lecturers to create activities in the classroom that build on the academic material learnt independently. This is in sharp contrast to the conventional, passive approach typically characterized by the process of listening to a lecture followed by an out-of-class 'homework' assessment activity. Research evidence is emerging which appears to be indicating a mixture of advantages and pitfalls of flipped-classroom learning, not least because it is too early to judge the impact that this revolutionary change in learning ideology may have on student achievement but also because difficulties in operationalizing clear definitions of what is meant by 'flipped classroom' is obfuscating conclusions that might be drawn from research outcomes (Bishop & Verleger, 2013). However, what has also emerged from this field of exploring the impact of collective efficacy on learning and student achievement is the liklihood that a new construct has been identified, that of academic optimism, pioneered in early research by Hoy et al (2006) and which is gathering credence as a valuable measure that can identify linkages between collective efficacy and raised levels of student achievement in learning environments (McGuigan & Hoy, 2006, Smith & Hoy, 2007).
In keeping with the points raised above, Bandura (2001) summarizes the application of the agentic perspective of social cognitive theory to education and learning by drawing attention to 21st century developments in technology that have influenced all domains of learning. This has shifted the focus from educational development being determined by formal education structures and institutions (that is, schools, colleges and universities) to new learning structures where information and knowledge is literally 'on demand' and at a learner's fingertips. By virtue of social cognitive theory attributing personal self-regulation to be a key determiner of behaviour, it is clear that in this new learning landscape, those who are more effective self-regulators are likely to be better at expanding their knowledge and cognitive competencies than those who are not (Zimmerman, 1990). However, a modern debate about the impact of social media on learning effectiveness is becoming quite polarized with traditionalists arguing that the high incidence of engagement with social media negatively impacts on learning capabilities because it appears to present a constant classroom distraction (Gupta & Irwin, 2016) which supports Zimmerman's point above by converse example. Alternatively, advocates of embracing social media platforms to provide an alternative format for curriculum delivery argue that to do so increases learning accessibility, fosters inter-learner collaboration and encourages students to communicate to each other about their learning much more readily (Lytras et al, 2014) even if there is less evidence to suggest that they use it for learning per se. One concern worthy of mention is the emergence of an increasing body of research evidence that explores internet, and in particular Facebook addiction with its impact on student learning being a particular focus (eg: Hanprathet et al, 2015). One study even developed a Facebook Addiction Scale to assess the impact of this social media platform on college students' behavioural, demographic and psychological health predictors (Koc & Gulyagci, 2013) and the likely impact on academic progress with the outcome broadly supporting a negative correlation between Facebook addiction and academic achievement, with another paper claiming strong evidence for the adverse effect of smartphone addiction on academic performance (Hawi & Samaha, 2016).
In terms of the brain-bending impact that technology may have on learning, Bandura argues that examining the brain physiology which is activated in order to enable learning is unlikely to guide educators significantly towards creating novel or challenging conditions of learning nor develop faculties of abstract thinking, nor how to encourage participation or incentivize attendance, nor how to become more skillful in accessing, processing and organizing information nor whether more effective learning is achieved cooperatively or independently (op cit, p19). Indeed, it has been left to other researchers, some who have collaborated with Bandura, to explore more sharply the impact of applying social cognitive theory to academic achievement. For example, a longitudinal study which commenced at about the same time as the publication of Bandura's (2001) originative paper, used structural equation modelling in a scientifically robust methodology to examine the predictive nature of prosocial behaviour in children - that is, where prosocial actions included cooperating, sharing, helping and consoling - on the later academic achievement and peer relations of them as adolescents. The outcome, perhaps not unsurprisingly, was that prosocialness appeared to account for 35% of the variance in later academic achievement in contrast to antisocialness (broadly in the form of early aggresion) which was found to have no significant effect on either academic achievement nor social preferences (Caprara et al, 2000).
To conclude this section, the graphic below attempts to draw from Bandura's extensive writings to summarize the various components and factors which enable the processes which emanate from individuals' self-efficacy beliefs to move them towards a behavioural outcome. It can be seen that the picture is far from straightforward but we might observe how self-efficacy beliefs and performance as an accomplishment can be considered as precursors to outcome expectancies and outcomes themselves. In the mix, we see control and agency beliefs, but of particular interest is the extent to which confidence might be considered as a strong agentic factor in the flow from self-efficacy and performance towards outcomes especially in the light of the discussion earlier which presented evidence that this process is not as unidirectional as Bandura would have us believe. Nevertheless, Nicholson et al (2013) suggested that confidence, in tandem with 'realistic expectations', were key drivers that can influence academic outcomes. Findings from their study supported their expectation at the outset that more confident students would achieve higher end-of-semester marks (ibid, p12), a point made in the opening introduction of this paper.
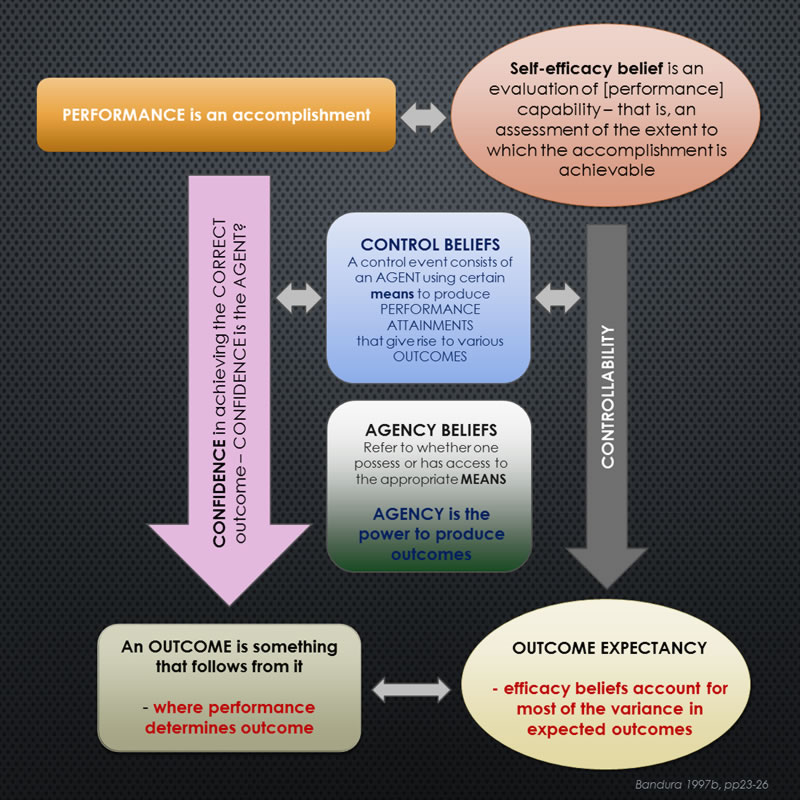
The next sub-section briefly reviews the contributions from other notable researchers to social cognitive theory in educational domains, ahead of moving the discussion into the domain of academic self-efficacy and particularly academic confidence as a sub-construct of academic self-efficacy, locating the discussion into the context of this research project.
Other notable and influential researchers: Pajares, Schunk, Zimmerman
Bandura's Social Cognitive Theory explains human behaviour according to the principles of triadic reciprocal causation as briefly summarized above, and as we have seen, researchers from many fields have sought to apply the ideas to their domain of interest.
Significantly, the application of SCT in the realms of education and learning has attracted a substantial body of research amongst educational psychologists, theorists and research-practitioners, with notable colleagues and collaborators of Bandura leading the field in the recent decades. Of these, the three that it might be argued have contributed the most towards exploring the application of SCT in educational settings are Zimmerman, Schunk and Pajares who have worked both individually and collaboratively to present theses that attempt to tease out a better understanding of how knowledge is constructed in learning processes through the lens of social cognitive theory. In particular, their interest has been in exploring self-efficacy beliefs as one type of motivational process in academic settings not least because motivation in learning has been widely accepted as one of the major contributing factors to academic achievement (eg: Pintrich, 2003, Harackiewicz & Linnenbrook, 2005). Studies include for example, exploring motivation and academic achievement in maths in Nigerian secondary school students (Tella, 2007), achievement motivation and academic success of Dutch psychology students at university (Busato et al, 2000), motivation orientations, academic achievement and career goals of music undergraduates (Schmidt & Zdzinski, 2006), academic motivation and academic achievement in non-specific curriculum specializations amongst Iranian undergraduates (Amrai et al, 2011) and in a substantial cohort (n = 5805) of American undergraduates (Mega et al, 2014). All of these studies indicated positive correlations between academic achievement and motivation although it was also a general finding that motivation in academic contexts can be a multidimensional attribute, succinctly observed by Green et al (2006) in their extensive longitudinal study of secondary students (n = 4000) in Australia.
Zimmerman and Schunk in particular have regularly collaborated on research papers and book chapters, and continue to jointly publish, especially in relation to the role of self-efficacy beliefs in the self-regulation of learning. Since their earlier, individual studies of the eighties and nineties, much of their later work is a repackaging of previous ideas and theories which have been regularly updated to incorporate and reflect on the later research of others. For example, their most recent work (Zimmerman et al, 2017), provides 'text-book' chapter-and-verse on self-efficacy theory aimed at students of psychology who are exploring competence and motivation in learning contexts. This paper specifically relates the cyclical processes model of self-regulation, which emerged broadly out of Bandura's triadic reciprocal causation foundation for Social Cognitive Theory, and discusses how it features within knowledge acquisition mechanisms widely employed by successful learners at all levels. This latest paper concludes with summary, admittedly small-sample, evidence to support the effectiveness of a Self-Regulation Empowerment Program (SREP), especially developed as an academic intervention that aimed to amend students' motivation, strategic learning and metacognitive skills in order to enhance academic achievement (ibid, p328). Encouraging results from this and other, broadly parallel studies (Cleary et al, 2016, Cleary & Platten, 2013), designed to test and validate the SREP showed that academic achievement of students taking part in the trails did indeed improve upon completion of the programmes and claims to show that by teaching students more about how to integrate self-regulation learning strategies into their study processes can bring academic rewards.
Many of Zimmerman's less recent papers which also reformalise much earlier work emphasize the idea of self-regulated learning as a central force that can drive academic achievement. Of this, it can be said that the examination of how individuals set learning goals and develop the motivation to achieve them has been Zimmerman's keen research interest, the outcomes of which have broadly demonstrated that students who are efficient at setting themselves specific and proximal goals tend to gain higher academic rewards when compared with other, less self-regulated peers (Zimmerman, 2002). Hence this evidence claims that becoming more self-aware as a learner is agentic in developing learning effectiveness (Zimmerman, 2001).
In reviewing the literature more carefully, three features of Zimmerman's research interests emerge that are significant:
- firstly, both his own, and his meta-analyses of others' studies, generally focus on finding out more about whether learners display the specific attributes of initiative, perseverance and adaptability in their learning strategies and explore how procative learning qualities are driven by strong motivational beliefs and feelings as well as metacognitive strategies (Zimmerman & Schunk, 2007);
- secondly, a 'soft' conclusion is reached arguing that, certainly as demonstrated in earlier research, skills and strategies associated with self-regulated learning had to be taught to students in order for them to subsequently gain academic advantages and that such strategies were seldom observed as spontaneous or intrinsically derived (eg: Pressley & Mc Cormick, 1995). This is interesting because it appears to support the approach adopted in higher education institutions (in the UK at least) that academic 'coaching' is likely to enhance academic achievement and, anecdotally at least, this coaching appears ubiquitous throughout universities who enroll learners from a wide range of backgrounds with an equally diverse portfolio of academic credentials.
 What is not clear without a deeper evaluation of the relevant literature is whether academic coaching is a remedial activity that is focused on bringing 'strugglers' up to the required standard, or whether in being repackaged as learning development or academic enhancement, coaching services are being more widely taken up by a much broader range of learners from the student community, or even whether the more general academic portfolio that learners are bringing to university is not a match for the challenges of the curriculum and hence demands learner upskilling. A more jaundiced interpretation may also be that as a result of recent government initiatives ostensibly to drive academic standards upwards through hierarchical university grading systems such as the Research Excellence Framework and more latterly, the Teaching Excellence Framework (Johnes, 2016), it is in the business interests of universities to maximize the visibility of their academic 'standing' so that this can be used as a student recruitment initiative. In such circumstances, it might be argued that fostering a learning climate based on curiousity and inquisitiveness has been superceded by a need to ensure financial viability, even survival, in an uncertain economic climate in higher education, and that the desire to attract students has led to a lowering of academic standards and an element of 'grade inflation' (Bachan, 2017). So far, detailed enquiries that explore these points more specifically have not been found aside from a doctoral thesis (Robinson, 2015) which was exploratory rather than evaluatative, and a few others which cast an element of disdain on the more general marketization of higher education with the student-as-consumer as the contemporary focus (eg: Nixon et al., 2016, if no others exist then such a study is surely overdue. Having said this, Barkley (2011) noted that in the US at least, commercial for-profit organizations are emerging which offer academic coaching to students and in the UK, flurries of discussion on internet forums established by the growing legion of academic skills tutors and learning developers (eg: Learning Development in Higher Education Network) regularly return to the thorny issue of commercial proof-reading services and how these might obfuscate the true academic abilities of students who pay for these services with some arguing that paid proof-reading borders on cheating.
 - The final observation is that in Zimmerman's and others' interest in developing devices to evaluate elements of self-regulated learning, these evaluative processes all seem to regard self-regulated learning as a global (learning) attribute and do not appear to have considered any domain specificity that may need to be accounted for. In other words, the assumption is that the study strategies that students apply are likely to be consistent across all their subject disciplines and no account is taken of differences that may be measurable in students' approaches to say, maths or sciences in contrast to studying humanities. This is all the more interesting given the American roots of both Zimmerman's research and the evaluative processes that his studies have contributed to because the curriculum in US tertiary education tends to be broader than here in the UK at least, and so we might have expected that the opportunity to explore curriculum differences in SRL would have been exploited. Other researchers who have explored self-regulated learning and its impact on achievement have adopted a more discipline-focused approach. For example, Greene et al (2015) specifically identified that as computer-based VLEs (Virtual Learning Environments) become more prevalent in places of learning, understanding how students' self-regulated learning may be different in science compared to history but their study was diverted into first exploring how to capture and model SRL which led to contradictory research outcomes which found both similarities and differences in SRL processing across domains.
 Additionally, building on earlier research about links between levels of achievement in academics and in sport (Jonker et al, 2009), McCardle et al (2016) studied Dutch competitive pre-university athletes and found that those presenting high engagement metacognitive processes and variables in their sports were also highly engaged in their academic studies. This is highlighting an important point as our earlier discussion above shows that within the umbrella of social cognitive theory under which self-regulated learning resides, the co-associated construct of self-efficacy beliefs has been shown to be more domain specific than general in not only learning contexts but in other areas of human functioning too. However this example of self-regulation in sport may be an indication that high engagement, self-efficacy beliefs can be a transferable learning approach. As we shall note from the discussion below, this is in keeping with the construct of academic confidence, considered as closely related to self-efficacy, but which appears to present as a more generalized learning attribute with variances across disciplines, academic or otherwise, being less observable (Sander & Sanders, 2009).
To return to our discussion about evaluative processes, these appear to have been developed not least due to the consensual definition of self-regulated learning which emerged from a seminal paper presented by Zimmerman (1986) to the American Educational Research Association. The paper sought to integrate contemporary researchers' work on learning strategies, volitional strategies, metacognitive processing and self-concept perceptions into a single rubric (Zimmerman, 2008, p167). The core idea of this definition was/is that self-regulated learning focuses on student proactivity in their learning processes as a means to enhance their academic achievement. This leads us to consider therefore, whether a 'good' or 'strong' student is more so the one who builds on intrinsic proactive learning strategies as opposed to an equally-achieving peer who has been taught self-regulated learning skills. This is pertinent in an increasing climate of student-coaching where those who have been coached subsequently derive academic enhancement. Given that assessment processes, notably summative ones where a student's performance is graded according to a mark achieved in a test or an exam, are supposed to be measuring student ability, if the exam outcome can be shown to have been significantly influenced through coaching, it follows that the assessment cannot be an accurate indication of the student's aptitude.
Schunk's contribution to research about the application of Social Cognitive Theory to educational domains follows a similar vein to Zimmerman's - hence their regular, collaborative projects. As another eminent student of Bandura's work, Schunk focused his research interests on learning more about the effects of social and learning-and-teaching variables on self-regulated learning with a particular emphasis on academic motivation, framed through the lens of Bandura's theories of self-efficacy (Schunk, 1991). In this early paper (ibid), goal-setting is said to be a key process that affects motivation, and in learning contexts Schunk's suggests that close-to-the-moment or 'proximal' learning objectives tend to elicit stronger motivational behaviours in children in comparison to more distant goals, an argument that is supported by a brief meta-analysis of other studies.  In young learners at least, Schunk finds that elevated motivation towards proximal learning goals is observed because students are able to make more realistic judgements of their progress towards these, whereas distant objectives by their very nature are said to require a much more 'regulated' approach - hence the interest and connection with self-regulated learning. Schunk also tells us that a significant difference in levels of motivation can be observed between target goals that are specific as opposed to those of a more general nature. In other words for example, this might be where an assessment requires a student to achieve a minimum mark in comparison to where a more general instruction to 'do your best' is provided as the target (ibid, p213). These are conclusions that are also evidenced in earlier studies: for example, in their meta-analysis of research of the previous two decades, Locke et al (1981) found that in 90% of the studies they considered, higher motivational levels of behaviour and subsequent performance were demonstrated towards specific goals when compared with targets that were easy to achieve, or learners were instructed to 'do your best', or no goals were set at all. Indeed, pursuant to modernizing goal-setting theory into contemporary contexts, Locke and his co-researchers (Latham & Locke, 2007) continue to expound the theory, particularly reminding us that goal-setting strategies continue to be driven by the two factors of the significance of the goal to the individual, and self-efficacy, but bring this into a modern (business, rather than educational) setting by deriving what they term as a 'High Performance Cycle' (Latham, 2007) which relates to how employee motivation is affected by specific challenges and high-goal demands.
In a later collaborative summary paper, Schunk furthers his thesis on academic self-regulation by explaining how this grows from mastery of self-reflective cycles in learning processes (Schunk & Zimmerman, 1998) drawing on earlier work which established how self-regulated students are differentiated from their peers by their goal-setting regimes, their self-monitoring accuracy and the resourcefulness of their strategic thinking (Schunk & Zimmerman, 1994). Both prior and subsequent papers (and book contributions) generally reframe the core ideas that underpin self-regulation in learning as a function of self-efficacy beliefs with the research agenda broadly pitched at school-aged learners (eg: Schunk, 1996, Schunk, 1989, Schunk, 1984). However some studies have had a more focused interest, not least in exploring how self-regulative learning approaches impact on children's uptake of reading and writing skills. A meta-analysis of prior research in this field integrated with some field work of his own led to the conclusion that fostering the development of self-regulative strategies is an imperative for teachers of reading and writing skills if learners are to use such self-regulative devices such as progress feedback, goal-setting and self-evaluations to enhance their academic achievement in these core areas of communication skills (Schunk, 2003).
However Schunk has also been interested in the social origins of self-regulative behaviours in learning contexts,, demonstrated through an interesting study which considered self-regulation from a social cognitive perspective, noting that through this lens, it can be shown that students' academic competencies tend to develop firstly from social sources of academic skill. This is an idea that draws on earlier and much vaunted sociocultural learning theory, typically attributed to Vygotsky's thesis about the zone of proximal development, which is where learners are said to develop academic capabilities through supportive associations with their peers as much as through a teacher. Academic competency acquisition then can be shown to progress through the four stages of observational, imitative, self-controlled and finally self-regulated learning (Schunk & Zimmerman, 1997). The authors recommended that further research should be conducted, not least into how peer-assisted learning might be established in learning environments and we have witnessed the legacy of this idea in universities where many such initiatives have been established in recent years. Advocates of such programmes cite studies which support their benefits in terms of improved grades and skills development (eg: Capstick et al, 2004, Hammond et al, 2010, Longfellow et al, 2008), and his has been especially true in medicine and clinical skills education. In these disciplines a development of peer-assisted learning, that of problem-based learning (PBL), actively generates learning through collaborative student learning enterprises. Here, only the required learning outcome has been specified with the route to the learning outcome mapped by the students participating in the programme, a process which includes the cooperative identification and thence distribution of component learning tasks, later to be brought back to the group for shared dissemination. Research outcomes show that such programmes can be effective learning mechanisms, are popular with students and can contribute to enhanced academic performance (Burke, et al, 2009, Secomb, 2008). However, PBL as a learning approach is not without its critics: For example, Kirschner et al (2006) claimed extensive evidence from empirical studies for the superiority for guided instruction not least because the instructive processes generally employed are aligned with human cognitive architecture and it is only when students are equipped a significant level of relevant prior knowledge to provide 'internal' guidance that PBL approaches can be shown to be of value. Counter to this, Hmelo-Silver et al (2007) responded by arguing that problem-based- and inquiry-learning can be highly effective tools in the development of not only the lasting retention of knowledge, but also in enabling learners to know more about their own metacognitive processes, especially when such learning environments include carefully scaffolded support structures that permit multi-domain learning to take place. Not least, such learning approaches develop 'soft' skills such as collaboration and self-direction (ibid). In a university context a much later study explored the delivery of learning enhancement through virtual forms in contrast to peer mentoring schemes (Smailes & Gannon-Leary, 2011). The backdrop for the project was an increasing awareness of the rapid advance in the use of social media and networking amongst the student cohort and the research concluded that implementing a peer-mentoring programme that used this platform would be worth developing as a means to counter the sharp reduction in interest amongst university learners for the conventional, face-to-face PALS programmes. To date, the outcome of the second stage of the project appears to have been unreported so it is not possible to comment on whether the researchers' expectations where met. It is of significant interest to my research project that little research evidence has been found which particularly explores the impacts of peer-assisted learning strategies (PALS) on learners with specific learning difficulties (that is, dyslexia). Nevertheless, Fuchs & Fuchs (1999, 2000) have reported positive results of such initiatives on high school students with 'serious reading problems' where evidence analysed from admittedly a very small sample (n=18) showed that poor readers who were participants in a specifically designed PALS initiative, developed better reading comprehension and fluency and reported enhanced self-belief for tackling their reading difficulties when compared to their contrast counterparts. It would be interesting to explore this avenue further, perhaps as a development of this current PhD project for a later time.
Pajares’ early research interest was to explore 'teacher thinking' and in particular, how teachers' beliefs about their work, their students, their subject knowledge, their roles and responsibilities could each or all impact on educational processes, not least the learning quality of their students. The core point to be drawn from this extensive essay was that teachers' beliefs should become an important focus for educational enquiry so as to contribute more fully towards understanding learning processes and engagement with education (Pajares, 1992). This line of research was supplanted in the mid-nineties with a deeper interest in self-efficacy beliefs and especially how these related to mathematical problem-solving in adolescents. A useful paper tried to establish key differences between math self-efficacy and math self-concept, finding that self-efficacy was a better predictor for problem-solving capabilities than other constructs, notably prior experience of maths and gender, in addition to math self-concept (Pajares & Miller, 1994). Other papers of this era exploring the relationships between maths self-efficacy beliefs and performance predictors showed support for Bandura's contention that due to the task-specific nature of self-efficacy, measures of self-efficacy should be closely focused on the criterial task being explored and the domain of function being analysed (Pajares & Miller, 1995). It is in these and other, related papers not only on a mathematics focus but also exploring the influences of self-efficacy beliefs on student writing, (eg: Pajares, 1996b, Pajares & Kranzler, 1995, Pajares & Johnson, 1995) that we see Bandura's self-efficacy theories enshrined and used to underpin much of Pajares' writing, not least drawn together in an important summary paper that sought to more generally apply Bandura's ideas to educational, academic settings (Pajares, 1996a) which also acted as a prequel for Pajares' deeper interest in the developing idea of academic self-efficacy.
 Work of a slightly later period maintained output focused on maths self-efficacy in undergraduates in US universities. For example one study conducted a contemporary review of a previously developed Maths Self-Efficacy Scale (Betz & Hackett, 1982) which is of interest to this project because it applied factor analysis to the scale's results when used with a sizable cohort of undergraduates (n = 522) (Kranzler & Pajares, 1997). Although the MSES had become a widely used and trusted psychometric assessment for establishing the interrelationships between maths self-efficacy and, for example, maths problem-solving, Kranzler & Pajares argued that looking at the factor structure of the scale is an essential process for gaining an understanding of the sources of variance which account for individual differences, claiming that this is required in order to substantiate results. Their study was the first to do this. As will be reported in a later part of this PhD thesis, factor analysis of the results collected from this project's data collection instrument has been an equally essential process in gaining an understanding about what the data means, and as will be presented later in more detail, has shown that factor structures established from previous deployment of a psychometric evaluator can not necessarily be applied to a fresh study - in this case, the factor structure for the Academic Behavioural Confidence metric (Sander & Sanders, 2009) is shown to be worthy of 'local' factor analysis because the factor structure for my results presented differences in comparison to that obtained by Sander & Sanders in their studies. The point is that through this statistical procedure, Pajeres and collaborators have shown a clear understanding of the multidimensional aspects of, in this case, maths self-efficacy but also the pertinence and value of local factor analysis being applied to local study-captured data. It was also interesting to note that for this study at least, Kranzler & Pajares' analysis led to their claim for the identification of a general meausre of self-efficacy which is at variance with Bandura's contention that self-efficacy beliefs are quite clearly context-specific (Bandura, 1997), and indeed also at variance with one of Pajares' own earlier studies (Pajares & Miller, 1995) which strongly argued for context specificity if research outcomes are to be considered reliable and valid. However, it is of note that in that study (ibid, 1995), the cohort of 391 undergraduate students' self-efficacy judgement were assessed according to three criteria: confidence to solve mathematical problems, confidence to succeed in math-related courses, and confidence to perform math-related tasks. Sanders' later (2006) contention is that (academic) confidence is a sub-construct of (academic) self-efficacy and although similar, the differentiation is necessary, and so we are left to consider that Pajares & Miller's study was in fact assessing maths self-confidence rather than maths self-efficacy albeit on the basis that this small but important distinction was yet to emerge. A deeper discussion of this difference is presented in the section below.
Key to this summary of Pajares' research output and contribution to self-efficacy theory in educational settings is more recent research and summary papers which sharpen his area of interest into the emerging field of academic self-efficacy (eg: Pajares & Schunk, 2001) and which is examined in more detail below. From this time onwards, a good deal of output was collaborative, for example with Schunk and Zimmerman as reported above, or summary or more generalized papers that reformatted earlier ideas and research into more contemporary contexts or were collections of earlier papers edited into lengthier handbooks (eg: Usher & Pajares, 2008, Schunk & Pajares, 2009, Pajares, 2008).
3. Academic Self-Efficacy
The construct of academic self-efficacy
Sed in consectetur leo, quis venenatis velit. Vivamus ipsum ante, rutrum eu urna consectetur, tempus dapibus augue. Nulla facilisi. Nullam quis orci sed dui ultricies finibus eu ut libero. Quisque in tempus lectus, et fermentum ligula. Nullam ullamcorper aliquam elit, at rutrum eros semper ut. Curabitur ut malesuada libero.
![]()
The relationships between academic self-efficacy and academic achievement
Sed in consectetur leo, quis venenatis velit. Vivamus ipsum ante, rutrum eu urna consectetur, tempus dapibus augue. Nulla facilisi. Nullam quis orci sed dui ultricies finibus eu ut libero. Quisque in tempus lectus, et fermentum ligula. Nullam ullamcorper aliquam elit, at rutrum eros semper ut. Curabitur ut malesuada libero.
![]()
Confidence as a learning attribute
In the period pre-1967 a search retrieval returned only 8 studies with the phrase ‘academic confidence’ anywhere in the text with none including the phrase in the title. Three of these were studies that were more concerned with proposals in 1960s for integrating learning communities in an otherwise racially segregated USA and referred to academic confidence only deprecatively. Of the other five, one was trying to understand more about the learning challenges faced by child ‘retardates’; a much earlier study focused on academic challenges faced by young asthmatics, and the others used the term in narratives that were otherwise unrelated to learning or education. The summary table below shows the increase in published research studies since this time:
| Date range | - 1967 | 1968 - 1977 | 1978 - 1987 | 1988 - 1997 | 1998 - 2007 | 2008 - 2017 |
| Criteria | ||||||
| Number of papers retrieved, n, with "academic confidence" found in the title or anywhere in the text * : | 8 | 26 | 42 | 200 | 695 | 2240 |
| Number of expected paper, N, based on exponential growth model: | 7 | 22 | 67 | 208 | 644 | 1996 |
| * using GoogleScholar, search conducted 28 February 2017 | ||||||
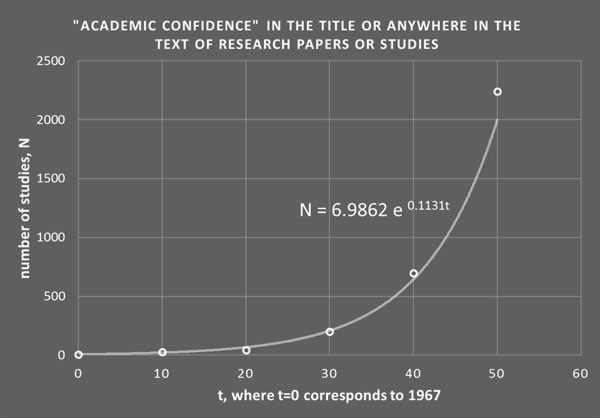 The number of actual items retrieved, n, from the search for each time-frame was plotted, and an exponential trendline generated in MS Excel was applied to the datapoints.
This generated the model equation shown in the graphic which was then used to generate the theoretical number of items that would be expected to be retrieved, N, using this exponential model.
As an illustration of real data demonstrating an exponential growth pattern, this is a clear example and may be indicative of the increasing recognition of academic confidence as a learning characteristic that can impact on the learning processes of individuals generally and academic achievement in particular. Or it may just be showing that the number of researchers has increased.
Either way, these data may be demonstrating a renewed interest in exploring learning processes in terms of new educational psychology that sought to relate non-cognitive functioning more closely to academic processes, previously thought of as largely unrelated as characteristics of learning. However, other interesting results emerged in the first instance through use of the phrase ‘learning confidence’ in place of academic confidence, and secondly by combining each of these phrases in a Boolean search with ‘academic achievement‘. The table below collects all the search output results together for comparison:
| Date range | - 1967 | 1968 - 1977 | 1978 - 1987 | 1988 - 1997 | 1998 - 2007 | 2008 - 2017 |
| Criteria | ||||||
| Number of papers, n, with " ~ " found in the title or anywhere in the text * | ||||||
| ~ = academic confidence | 8 | 26 | 42 | 200 | 695 | 2240 |
| ~ = learning confidence | 15 | 9 | 60 | 105 | 537 | 1610 |
| ~ = academic confidence AND academic achievement | 4 | 12 | 15 | 89 | 290 | 1160 |
| ~ = learning confidence AND academic achievement | 0 | 1 | 6 | 12 | 69 | 266 |
| * using GoogleScholar, search conducted 28 February 2017 | ||||||
It should be noted that this is the literature broadly available as returned according to search constraints applied and there is not the scope in this study to explore in detail the greater relevance of most of the output, setting aside of course, research that directly informs this project. However, a cursory inspection of the first few items returned in each search indicated that with the exception of studies where academic confidence, for example, was the primary focus of the research, the term tended to be used in a much more generally descriptive rather than evaluative way, or otherwise was measured using a relatively surface-based approach. For example, Hallinan (2008) was interested in the attitudes of school students to their school and how their perceived view about their teachers influenced this. Although the focus of the study was to explore ways to increase academic outcomes by improving students’ attraction to school, the attribute of academic confidence was only one of four variables used to do this and data was collected through acquiescence responses to just one statement: “I am certain I can master the skills taught in this class” (ibid, p276). Hallinan’s greater interest was in measuring clearly non-cognitive factors such as the extent to which students felt their teachers ‘cared’ about them, or how ‘fair’ they thought their teachers were. It was also apparent that the search output for the phrase ‘learning confidence‘ also returned results that included incidences where both were used as separate nouns rather than ‘learning‘ used in an adjectival form to describe the attribute of ‘confidence‘. Taking this into account suggests that the number of items returned using the phrase ‘learning confidence‘ may be an over-representation of the true number of papers which used the attribute in the way that ‘academic‘ is used to describe ‘confidence‘.
Thus there is a demonstrable increase in research interest in confidence as an attribute that can be attached to learning and academic progress. However it also seems apparent that much as in many research domains, not least those engendered in this research study, clearly defining a shared meaning to the term ‘attribute‘ can be problematic, especially so when specifically related to learning – that is ‘learning attributes’. Semantic differences can conflate research and my own practitioner experience in mathematics education has taught me that semantic clarity is key to early understanding – especially of concepts – and this has fostered a disposition towards visualization and iconography in designing and developing teaching resources to support my subject and more broadly as a mechanism for communicating ideas and expressing knowledge.
As presented in the overview of this narrative, Stankov's (2012) definition of confidence as 'a robust characteristic of individual differences' works well. Since the late 1980s, Stankov has been publishing research exploring aspects of individual differences and how these impact on learning and education. Ranging from early papers exploring , for example, how training in problem-solving might expose differences in its effects on fluid- and general intelligence (Stankov & Chen, 1988) to a substantial body of more recent research that focuses on unpicking the wealth of data additional to academic achievement that is collected through triennial PISA (Programme for International Student Assessment) assessments. PISA is a battery of tests and questionnaires completed across OECD nations that assesses the skills and knowledge of a snapshot of 15-year-olds. PISA has been running since 2000 and in addition to assessing academic competencies, also collects data about other student characteristics such as their attitudes to learning and how the participants approach their studies from a non-cognitive perspective. One of Stankov's most recent papers (2016) exploited the data reservoir of the latest, 2013 PISA survey, with the focus being on connecting the non-cognitive construct of self-belief to achievement in maths. The study draws on the premise that in addition to other non-cognitive variables (in particular, socio-economic status), self-beliefs are significant effectors of cognitive performance - that is, academic achievement - as either impediments in the form of anxiety, or facilitators where self-efficacy and confidence are the two major determiners.
[1162 / 63,074 (at 08 Jan 2018)]
![]()
The location of academic confidence within the construct of academic self-efficacy
Sed in consectetur leo, quis venenatis velit. Vivamus ipsum ante, rutrum eu urna consectetur, tempus dapibus augue. Nulla facilisi. Nullam quis orci sed dui ultricies finibus eu ut libero. Quisque in tempus lectus, et fermentum ligula. Nullam ullamcorper aliquam elit, at rutrum eros semper ut. Curabitur ut malesuada libero.
![]()
Academic confidence and learning differences
Sed in consectetur leo, quis venenatis velit. Vivamus ipsum ante, rutrum eu urna consectetur, tempus dapibus augue. Nulla facilisi. Nullam quis orci sed dui ultricies finibus eu ut libero. Quisque in tempus lectus, et fermentum ligula. Nullam ullamcorper aliquam elit, at rutrum eros semper ut. Curabitur ut malesuada libero.
![]()
Measuring academic confidence: the Academic Confidence Scale
In her doctoral dissertation, Decandia (2014) looked at relationships between academic identity and academic achievement in low-income urban adolescents in the USA. Although briefly reporting on the original Academic Confidence Scale developed by Sander & Sanders in 2003, her study chose to use neither that metric, nor the more recently developed version – the Academic Behavioural Confidence Scale (reported below) – but instead reverted to an Academic Confidence Scale originating in a near-twenty-year-old doctoral thesis (McCue-Herlihy, 1997), which she developed as ‘an organic measure of confidence in academic abilities’ (op cit, p44) for her study. This earlier thesis by McCue-Herlihy does not appear to have been published and thus is not available to consult although it is assumed, remains lodged in its home-university repository at the University of Maine. However this is of interest, as McCue-Herlihy’s Academic Confidence Scale appears to be the first time such a metric was constructed. In her study it seems it was created to contribute towards gauging self-efficacy, academic achievement, resource utilization and persistence in a group of non-traditional college students.
![]()
Academic Behavioural Confidence
Academic Behavioural Confidence is the key metric that is being used in this research project.
It is being applied as a comparator to the three research subgroups of interest: students with existing, identified dyslexia; students with no identified dyslexia but who present a dyslexia-like profile of study and learning attributes as indicated through the Dyslexia Index metric (developed for this project); and students with no previously identified dyslexia and who also present a very low incidence of dyslexia-like study and learning attributes. As outlined above, academic confidence, through being a sub-construct of academic self-efficacy may also be linked to the academic outcomes and achievement of students at university. Hence measures obtained through the application of the Academic Behavioural Confidence Scale to the three, research subgroups are interesting even though no research evidence has been found to date to show that absolute scores of ABC are directly linked to absolute academic outcomes such as degree classification or grade point averages. It is suggested that a study to explore this is overdue.
However, by comparing ABC values between the three research groups of interest in this project, it will be clearly demonstrated that for this research datapool at least, the academic behavioural confidence of students with dyslexia is statistically lower than for non-dyselxic students, but also lower than for students with unreported dyslexia-like profiles.
Historical development of the Academic Behavioural Confidence Scale
The ABC Scale is a development of an earlier metric used to explain the differences in students’ expectations in the teaching-and-learning environment of university (Sander et al, 2000). In that study, the research group comprised students from three disparate disciplines enrolled on courses at three different UK universities and the study emerged out of interest in the expectations of students following fresh thinking (at the time) in higher education about the increasing shift to consider students as ‘customers’ for university ‘products’ (Hill, 1995) – that is, more as consumers of the knowledge and learning that comprised the curriculum in a university course.
The student groups comprised medical students (n=167), business studies students (n=109) and psychology students (n=59) with the cohorts each studying at a different university. The questionnaire that was deployed interrogated students’ expectations of teaching and learning methods and respondents were requested to indicate their preferences. Aside from results and discussion that were specifically pertinent to this study, the construct of academic confidence was proposed as a possible explanation for significant differences in groups’ preferences in relation to role-play exercises and of peer-group presentations as approaches for delivering the respective curricula. In particular, the group of medical students and the group of psychology students both expressed strong negativity about both of these teaching approaches but it was the difference in reasons given that prompted interest: the medical students cited their views that neither of these teaching approaches were likely to be effective whereas the reasons given by the psychology students attributed their views about the ineffectiveness of both approaches more to their own lack of competence in participating in them. Sander et al suggested that these differences may have arisen as a result of academic confidence stemming from the different academic entry profiles of the two groups.
The idea of academic confidence was developed into the metric: Academic Confidence Scale (ACS) (Sander & Sanders, 2003), where academic confidence was conceptualized as enshrining differences in the extent to which students at university express strong belief, firm trust or sure expectation about what the university learning experience will be offering them. This implies that academic confidence is regarded as a less domain-specific construct than academic self-efficacy which is significant for the researcher as it enables the metric to be used more generally to explore attitudes and feelings towards study at university without these being focused on an academic discipline or specific academic competency – dealing with statistics, for example, or writing a good essay. Nevertheless, acknowledging academic confidence as a sub-construct of academic self-efficacy, this later study set out to explore the extent to which academic confidence might interact with learning styles or have an impact on academic achievement. Academic confidence was proposed to be a ‘mediating variable between an individual’s inherent abilities, their learning styles and the opportunities afforded by the academic environment of higher education’ (ibid, p4). In this later study two further groups of medical and psychology students were recruited (again at two different universities, n=182, n=102 respectively) although the aim of this research was to explore changes in academic confidence between two time-points in the students’ studies. The gist of the research outcome was first of all that academic confidence was moderated by academic performance rather than acted as a predictor, and secondly that these students at least, commenced their studies with unrealistic expectations about their academic performance that was tempered by actual academic assessment outcomes – perhaps unsurprisingly.
However, construct validity was established for the ACS and a preliminary factor analysis was also conducted although differences between the factor loadings for the two student groups led the researchers to conclude that analysis on a factor-by-factor basis would be inappropriate in this study at least. Although the 24 Likert-scale items remained unaltered, the ACS was renamed as the Academic Behavioural Confidence Scale some three years after its original development to more closely acknowledge the scale as a gauge of confidence in actions and plans in relation to academic study behaviour (Sander & Sanders, 2006b).
Subsequent research interest in the Academic Confidence Scale in the intervening period between its original development and its 2005 revision into the Academic Behavioural Confidence Scale was modest. Of the 18 studies found, these ranged from an exploration of music preferences amongst adolescents, relating these to personality dimensions and developmental issues (Schwartz & Fouts, 2003) which although included academic confidence as a metric in the data evaluation, it appears to have been derived from one of the 20 scales included in the Millon Adolescent Personality Inventory (Millon et al, 1982), implying that at the time of the study, the researchers were unaware of the recently developed Academic Confidence Scale; to a study exploring university students’ differences in attitudes towards online learning (Upton & Adams, 2005) which used the Academic Confidence Scale as one of a battery of 5 metrics in a longitudinal survey which aimed to gauge the impact of student engagement with an online health psychology module before and after the module was completed. The design focused on determining whether or not measures of academic confidence, self-efficacy and learning styles were predictors of performance on the module and hence which students would benefit most from this form of curriculum delivery. The study’s data analysis revealed no significant relationship between the variables measured and student engagement with the module from the 86 students included in the survey with the disappointed researchers claiming with hindsight that the lack of observable differences may have been attributed to an ill-advised research design and inappropriate choices of measures.
Lockhart (2004) conducted an interesting study about attrition amongst university students which was the first to explore the phenomenon using a sample of student drop-outs, acknowledging the range of difficulties that exist in contacting individuals who have already left their courses and to encourage their participation. As a result, the survey was small (n=30, in matched pairs of students remaining at, and students who had left university) but nevertheless a comprehensive battery of questionnaire items was used which were drawn from several sources, together with a programme of semi-structured interviews. The Academic Confidence Scale was incorporated into the research questionnaire with a view to exploring how different levels of confidence were related to student expectations of higher education. Care was taken to eliminate academic ability as a contributor to differences in academic confidence by matching pairs of participants for course subject and prior academic attainment. One of the research outcomes determined academic confidence to be a significant contributor to attrition, reporting that higher levels were recorded on the Academic Confidence Scale for participants remaining at university compared with those who had left their courses, although it was acknowledged that many other factors also had a strong influence on students’ likelihood of leaving university study early. Of these, social and academic integration into the learning community and homesickness in the early stages of study were cited as the most significant. However Lockhart’s results also appeared to indicate academic confidence to be a transitory characteristic which is affected by the most recent academic attainments – not unsurprisingly. This is consistent with the idea of academic confidence as a malleable characteristic, which had been suggested earlier through Sander’s original research and more strongly proposed in a later, summary paper (Sander et al, 2006a). In a study, similar to Lockhart’s, also into student retention and likelihood of course change, Duncan, (2006) integrated 5 items from the Academic Confidence Scale into the research questionnaire on the grounds that data obtained may offer insights into the mediating effect of academic confidence on the relationship between academic ability and academic integration, although no reasons for identifying these specific items from the full ACS as being particularly appropriate were offered. It is possible that the reason was simple expediency for reducing the questionnaire to a manageable size since, with a total of 151 Likert-style scale items, it is surprising that the researcher received data from a such a numerically robust sample (n=195) of final year university undergraduates although it is not known what percentage return rate this represents. In any event, results indicated academic confidence to be strongly positively correlated with the research hypothesis which was theorizing course-change or drop-out intention. The correlation outcome is presumably strongly positively correlated with the null hypothesis although this was not clearly indicated. It would be a highly unexpected result if it emerged that high levels of academic confidence were related to high levels of attrition! ![]()
A highly focused study used academic confidence in relation to the influences of assessment procedures on the confidence of teachers-in-training, in particular the use of video recordings of teaching sessions (White, 2006). A mixed-methods design appears to have been used which combined questionnaire items with semi-structured interviews with participants (n=68) who were all level 7 students (= Masters level (QAA, 2014)). The research objective was to explore whether video assessment processes would mitigate uncertainties about lesson planning and delivery and increase self-efficacy and confidence. The Academic Confidence Scale per se was not used but elements of it were imported into the data collection process. Results were not discretely related to the construct of academic confidence but were used to support a much more general use of the term ‘confidence’ in the context of teaching planning and delivery. Hence the research outcomes in relation to academic confidence as described by Sander were undetermined and again, it is possible that the availability of the Academic Confidence Scale was not known to the researcher at the time of the study.
Of the remaining 13 studies out of the 18 retrieved that included use of the Academic Confidence Scale, all were either conducted by Sander, usually in collaboration with others, or Sander appears to have been a contributing author. This collection of studies includes Sander’s own doctoral thesis (Sander, 2004) which explored the connections between academic confidence and student expectations of their university learning experience and built on the original project for which the Academic Confidence Scale was developed. The thesis comprised the author’s prior, published works which were all concerned with exploring students’ expectations and preferences towards teaching, learning and assessment at university. It was for this purpose that the Academic Confidence Scale was originally developed and subsequently used as the principal metric. These early studies increased confidence in the use of academic confidence to explain differences in students’ learning preferences with the findings providing evidence to argue for a greater understanding of students as learners (Sander, 2005a, Sander, 2005b) in order for learning in higher education settings to be more effective. This was pertinent in the university climate a decade or so ago which was witnessing student numbers increasing to record levels through a variety of initiatives, not least the emergence of widening participation as a social learning construct in education and the greater diversity of students that this and other new routes into higher education through foundation and access courses was bringing to the university community. With this, brought a greater attrition rate (eg: Fitzgibbon & Prior, 2003, Simpson, 2005) and so research attention on finding explanations for this was spawned.
The first of Sander’s studies to utilize the newly-named Academic Behavioural Confidence (ABC) Scale extended early research interest in the impact of engaging in peer-presentations on students’ confidence at university (Sander, 2006). As with earlier studies, the research was driven by a desire to find ways to improve university teaching by understanding more about students’ attitudes towards teaching processes commonly used to deliver the curriculum. Two broadly parallel participant groups were recruited (n=100, n=64 respectively) and all were psychology students, mostly female. The research aimed to determine whether significant differences in academic confidence could be measured depending on whether students were delivering non-assessed, compared with assessed presentations. Results indicated that despite the initial (and previously observed and reported (Sander et al, 2002, Sander et al, 2000)) reluctance of students to prepare and present their knowledge to their peers, beneficial effects on academic confidence of doing so were observed. Students typically reported these benefits to include experience gained in interacting with peers and hearing alternative perspectives about their learning objectives (op cit, p37). An interesting outcome from this study showed significant differences in post-presentation academic confidence attributed to whether the presentations were assessed or not assessed, with measurable gains in ABC being recorded following presentations that were assessed. Of particular interest in the discussion was an item-by-item analysis of ABC Scale statements suggesting this process as worthwhile for a better understanding of participant responses to be gained. This indicates that although ABC is designed to be a global measure of academic confidence, exploring specificity, as revealed by comparisons taken from items within the scale, can reveal greater detail about an academic confidence profile. Following their presentations, all participants in this study showed an increase in ABC items that related to public speaking.
A slightly later study explored gender differences in student attitudes towards the academic and the non-academic aspects of university life. Results from analysis of data collected using the ABC Scale showing that males gave a lower importance rating to their academic studies in relation to the non-academic side of being at university in comparison to females (Sander & Sanders, 2006b). Drawing on literature evidence arguing that females generally lack academic confidence and that males are more likely to rate their academic abilities more highly than female students, findings obtained through the ABC Scale questionnaire were, however, inconclusive with no overall differences in ABC between males and females being identified. This was explained as most likely due to the relatively small research group (n=72) and the strong female participant bias both in students enrolled on the course (psychology, females = 82.4%) and in the survey (80.6%) which it was suggested would have added a significant skew to the research outcome.
Pursuing a similar agenda, a susequent study (Sander & Sanders, 2007) added to the earlier evidence (op cit) about noticeable gender-differences in attitudes to study revealed through use of the ABC Scale, which confirmed some previous findings about measurable differences in academic confidence between male and female undergraduates, but in this study, being observed particularly during their first year of university study. Key findings proposed that male students may be disadvantaging themselves due to a different orientation to their academic work which, it was suggested, compounded other issues faced by male psychology students through being in a significant minority in that discipline. Again, interesting individual-item differences were revealed showing, for example, that male students were significantly less likely to prepare for tutorials and also less likely to make the most of studying at university in comparison to their female peers both of which Sander’s regards as dimensions that impact on academic confidence. These findings were consolidated by returning to the same student group at a later date, hence creating a longitudinal study. Although students from both genders were included in the study, the research focused specifically on the academic confidence of male students (Sanders, et al, 2009). Once again, whilst there was little significant difference between ABC scores of males and females overall, detail differences on an item-by-item basis did emerge which were attributed to a measure of over-confidence in males’ expectation of academic achievement – especially in the first year of study. However the researchers noted that this perception was not displaced later, as actual academic achievement was comparable overall to that achieved by females and suggested that in this study at least, males saw themselves as able to achieve as good a result as females but with less work, with poorer organization and less engagement with teaching sessions.
Meanwhile, other studies using the Academic Behavioural Confidence Scale were beginning to emerge, possibly as a result of more widespread interest in a seminal paper presented by the original researchers (Sander & Sanders, 2006a) that summarized and consolidated their findings to date, which presented evidence of binding their theories about academic confidence and how it affected student learning and study behaviours more closely to the substantial body of existing research on academic self-efficacy, summarized briefly earlier. In this paper, useful comparisons between attributes of the related constructs of academic self-concept, academic self-efficacy and academic behavioural confidence were made, which drew on a lengthy comparative review (of the two former constructs) grounded in theories of academic motivation (Bong & Skaalvik 2003). The comparison table is reproduced here as a useful summary of dimensions of all three constructs:
| Comparison dimension | Academic self-concept | Academic self-efficacy | Academic Behavioural Confidence |
| Working definition | Knowledge and perceptions about oneself in achievement situations | Convictions for successfully performing given academic tasks at designated levels | Confidence in ability to engage in behaviour that might be required during a (student) academic career. |
| Central element | Preceived competence | Perceived confidence | Confidence in abilities |
| Composition | Cognitive and affective appraisal of self | Cognitive appraisal of self | Assessment of potential behavioural repertoire |
| Nature of competence evaluation | Normative and ipsative | Goal-referenced and normative | Response to situational demands |
| Judgement specificity | Domain specific | Domain specific and context specific | Domain and narrowly context specific |
| Dimensionality | Multidimensional | Multidimensional | Multidimensional |
| Structure | Hierarchical | Loosly heirarchical | Flat and summative |
| Time orientation | Past-oriented | Future-oriented | Future-oriented |
| Temporal stability | Stable | Malleable | Malleable |
| Predictive outcomes | Motivation, emotion and performance | Motivation, emotion, cognition and self-regulatory processes and performance | Motivation, coping, help-seeking and performance |
| (Sander & Sanders, 2006a, Table 1, p36; adapted from Bong & Skaalvik, 2003) | |||
[3291 / 63,074 (at 08 Jan 2018)]
![]()
Use of the ABC Scale in this research project
Sed in consectetur leo, quis venenatis velit. Vivamus ipsum ante, rutrum eu urna consectetur, tempus dapibus augue. Nulla facilisi. Nullam quis orci sed dui ultricies finibus eu ut libero. Quisque in tempus lectus, et fermentum ligula. Nullam ullamcorper aliquam elit, at rutrum eros semper ut. Curabitur ut malesuada libero.
![]()
Research Design
Research Design Section Contents:
- OVERVIEW
- Design Focus
- Metrics
- Analysis and results
- METHODOLOGY
- Stance
- Workflow chronology
- The preceeding MSc small-scale enquiry
- Defining dyslexia: the professional practitioners' view
- Existing dyslexia evaluators and identification processes - why these were dismissed
- Development of the Dyslexia Index Profiler
- Dimensions of dyslexia in higher education settings
- Evolution of the Dx Profiler
- Internal consistency reliability
- Measuring academic confidence using the Academic Behavioural Confidence Scale
- Collecting information - the rationales, justifications and challenges
 Overview
The aims and objectives of this research project together with the clear research questions have been set out above.
This section, reporting on the Research Design, describes the blueprint for the strategic and practical processes of the project that were informed at the outset by the researcher's previous Master's dissertation, subsequently by the relevant literature - including identifying where gaps in existing knowledge became evident - and not least by the researcher's deep desire, as a learning practitioner in higher education, to explore how dyslexic students perceive the impact of their dyslexia on their study behaviours, attitudes and processes at university in comparison with their non-dyslexic peers. In addition to conducting a study in this under-researched area which is highly interesting in itself, the driving rationale has been that the outcomes of the research might usefully contribute to the gathering discourse about how knowledge acquisition, development and creation processes can be transformed in higher education in ways that more significantly adopt principles of equity, social justice and universal design (Lancaster, 2008, Passman & Green, 2009, Edyburn, 2010, Cavanagh, 2013), and to especially promote the wider acceptance that dyslexia may now be best considered as an alternative form of information processing (Tamboer et al, 2014) rather than a learning disability (eg: Heinemann et al, 2017, Joseph et al, 2016, amongst numerous other studies).
Descriptions are provided about how practical processes were designed and developed to enable appropriate data sources to be identified and how data has been collected, collated and analysed so that the research questions might be properly addressed. The rationales for research design decisions are set out and justified, and where the direction of the project has diverted from the initial aims and objectives, the reasons for these changes are described including the elements of reflective processes that have underpinned project decision-making and re-evaluation of the focus of the enquiry where this has occurred. The originality of the research rationale will be emphasized and justification made as to the equally original final presentation of the project outcomes because this will be a combination of this traditionally-written thesis and an extensive suite of webpages that have been constructed by the researcher as part of the learning development process that this doctorate-level study has contributed to. The project webpages have served as a sandbox for project ideas and development of some of the technical processes, particularly related to data collection and for diagramatically representing data outputs; the webpages have diarized the project, contain a reflective commentary on the project's progress throughout its 3-year timescale which is in the form of a Study Blog; and contain, present and visualize the data collected. An electronic version of the final thesis is published on the project webpages, notably so that pertinent links to supportive, online material contained elsewhere on the webpages can be easily accessed by the reader.
Design focus
This primary research project has taken an explorative design focus because little is known about the interrelationships between the key parameters being investigated and so no earlier model has been available to emulate. The main emphasis has been to devise research processes which are able to establish empirical evidence to support previously anecdotally observed features of study behaviour and attitudes to learning amongst the dyslexic student community at university. These were study characteristics that appeared to the researcher to be driven more so by students' feelings about their dyslexia and what being identified as 'dyslexic' meant to their study self-identity rather than ones that might be expected to be more directly influenced by the obstacles and impediments to successful academic study, apparently attributable to their dyslexia, when functioning in a literacy-based learning environment. This was first explored in the Master's research dissertation (Dykes, 2008) which preceded this PhD project, is available here, and which has contributed to this current project almost as a pilot study.
The fundamental objective has been to establish a sizeable research group datapool that comprised two principal subgroups: the first was to be as good a cross-section of higher education students as may be returned through voluntary participation in the project; the second was to be a control group of students known to have dyslexic learning differences by virtue of a) acquiring them as participants through a request targeted specifically at the university's dyslexic student community, and b) through their self-disclosure in the project questionnaire. In this way, it was felt that it could be assumed that students recruited from this cohort will previously have been formally identified as dyslexic through one or more of the currently available processes, for example as an outcome from an assessment by an educational psychologist either prior to or during their time at university. Subsequently, the research aim was twofold: firstly to acquire a sense of all research participants' academic confidence in relation to their studies at university; secondly to establish the extent of all participants' 'dyslexia-ness' and this has been a key aspect of the project design because from this, it was planned that students with dyslexia-like profiles might be identified from the research subgroup of supposedly non-dyslexic students. Quantitative analysis of the metrics used to gauge these criteria have addressed the primary research questions which hypothesize that knowing about one's dyslexia may have a stronger negative impact on academic confidence than not knowing that one may be dyslexic. Hence suggesting that labelling a learner as dyslexic may be detrimental to their academic confidence in their studies at university, or at best, may not be as useful and reliable as previously believed (Elliott & Grigorenko, 2014).
The research has devised an innovative process for collecting original data by utilizing recently developed enhanced electronic (online) form design processes (described below), analysed it and interpreted the analysis outcomes in relation to the research questions posed at the outset and to existing literature. The research participants were all students at university and no selective nor stratified sampling protocols were used in relation to gender, academic study level or study status - that is, whether an individual was a home or overseas student - although all three of these parameters were recorded for each participant respondent and this data has been used throughout the analysis and discussion when considered apposite. For students recruited into the dyslexic students research subgroup, information was also collected in the questionnaire which recorded how these students learned of their dyslexia because it was felt that this may be pertinent to the discussion later relating to the effects of stigmatization on academic study. A dissemination of the results, together with a commentary is presented below and incorporated into the discussion section of this thesis where this has been helpful in trying to understand what the outcomes of the data analysis mean.
 The research design has adopted a mixed methods approach although the main focus has been on the quantitative analysis of data collected through the project's participant self-report questionnaire. The questionnaire was designed and developed for electronic deployment through the research project's webpages and participants were recruited voluntarily on the basis of responding to an intensive period of participant-request publicity kindly posted on the university's main, student-facing webpages for a short period during the academic year 2015-16, and also through the researcher's home-university Dyslexia and Disability Service student e-mail distribution list. The raw score data was collected on the questionnaire using a Likert-style item scale approach, although the more conventionally applied, fixed anchor point scale items have been discarded in favour of a continuous scale approach which has been uniquely developed for this project by taking advantage of new 'form' processes now available for incorporation into web-browser page design. The rationale for designing continuous Likert scale items was to try to avoid the typical difficulties associated with anchor-point scales where the application of parametric statistical processes to non-parametric data is of questionable validity (Ladd, 2009, Carifio & Perla, 2007). A more detailed argument to support this choice is presented below.
In addition to recording value scores, research participants were also encouraged to provide qualitative data if they chose to, which has been collected through a 'free-text' writing area provided in the questionnaire. The aim has been to use these data to add depth of meaning to the hard outcomes of statistical analysis where possible.
This method of data collection was chosen because self-report questionnaires have been shown to provide reliable data in dyslexia research (eg: Tamboer et al, 2014, Snowling et al, 2012); because it was important to recruit participants widely from across the student community of the researcher's home university and where possible, from other HE institutions; because it was felt that participants were more likely to provide honest responses in the questionnaire were they able to complete it privately, hence avoiding any issues of direct researcher-involvement bias; because the remoteness of the researcher to the home university would have presented significant practical challenges were a more face-to-face data collection process employed.
So as to encourage a good participation rate, the questionnaire was designed to be as simple to work through as possible whilst at the same time eliciting data covering three broad areas of interest. Firstly, demographic profiles were established through a short, introductory section that collected personal data such as gender, level of study, and particularly whether the participant experienced any specific learning challenges; the second section presented verbatim the existing, standardized Academic Behavioural Confidence Scale as developed by Sander & Sanders (2006, 2009) and tested in other studies researching aspects of academic confidence in university students (eg: Sander et al, 2011, Nicholson, et al, 2013, Hlalele & Alexander, 2011). Lastly, a detailed profile of each respondent's study behaviour and attitudes to their learning has been collected and this section formed the bulk of the questionnaire. The major sub-section of this has been the researcher's approach to gauging the 'dyslexia-ness' of the research participants and care has been taken throughout the study to avoid using value-laden, judgmental phraseology such as 'the severity of dyslexia' or 'diagnosing dyslexia' not least because the stance of the project has been to project dyslexia, such that it might be defined in the context of university study, as an alternative knowledge acquisition and information processing capability where students presenting dyslexia and dyslexia-like study profiles might be positively viewed as being neurodiverse rather than learning disabled.
Metrics
Academic confidence has been assessed using the existing, Academic Behavioural Confidence Scale because there is an increasing body of research that has found this to be a good evaluator of academic confidence presented in universlty-level students' study behaviours. Secondly, no other metrics have been found that explicitly focus on gauging confidence in academic settings (Boyle et al, 2015) although there are evaluators that measure self-efficacy and more particularly academic self-efficacy, which, as described earlier, is considered to be the umbrella construct that includes academic confidence. Hence, the Academic Behavioural Confidence Scale is particularly well-matched to the research objectives of this project and comes with an increasing body of previous-research credibility to support its use in the context of this study. A more detailed profile of the ABC Scale has been discussed above.
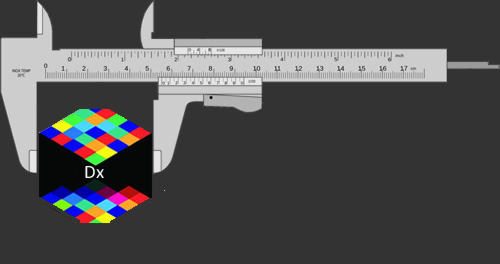 Dyslexia-ness has been gauged using a profiler designed and developed for this project as a dyslexia disrciminator that could identify, with a sufficient degree of construct reliability, students with apparently dyslexia-like profiles from the non-dyslexic group. It is this subgroup of students that is of particular interest in the study because data collected from these participants were to be compared with the control subgroups of students with identified dyslexia and students with no indication of dyslexia. For the purposes of this enquiry, the output from the metric has been labelled as Dyslexia Index (Dx), although the researcher acknowledges a measure of disquiet at the term as it may be seen as contradictory to the stance that underpins the whole project. However, Dyslexia Index at least enables a narrative to be contructed that would otherwise be overladen with repeated definitions of the construct and process that has been developed.
Designing a mechanism to identify this third research subgroup has been one of the most challenging aspects of the project. It was considered important to develop an independent means for quanitifying dyslexia-ness in the context of this study in preference to incorporating existing dyslexia 'diagnosis' tools for two reasons: firstly, an evaluation that used existing metrics for identifying dyslexia in adults would have been difficult to use without explicitly disclosing to participants that part of the project's questionnaire was a 'test' for dyslexia. It was felt that to otherwise do this covertly would be unethical and therefore unacceptable as a research process; secondly, it has been important to use a metric which encompasses a broader range of study attributes than those specifically and apparently affected by literacy challenges not least because research evidence now exists which demonstrates that students with dyslexia at university, partly by virtue of their higher academic capabilities, many have developed strategies to compensate for literacy-based difficulties that they may have experienced earlier in their learning histories. But also because in higher education contexts, research has also revealed that other aspects of the dyslexic self can impact significantly on academic study and that it may be a mistake to consider dyslexia to be only a literacy issue or to focus on cognitive aspects such as working memory and processing speeds (Cameron, 2015). In particular, those processes which enable effective self-managed learning strategies to be developed need to be considered (Mortimore & Crozier, 2006), especially as these are recognized as a significant feature of university learning despite some recent research indicating at best marginal, if not dubious, benefits when compared with traditional learning-and-teaching structures (Lizzio & Wilson, 2006). Following an inspection of the few, existing dyslexia diagnosis tools considered applicable for use with university-level learners (and widely used), it was concluded that these were flawed for various reasons (as discussed above) and unsuitable for inclusion in this project's data collection process. Hence, the Dyslexia Index Profiler has been developed and, as the analysis report details below, has fulfilled its purpose for discriminating students with dyslexia-like study characteristics from others in the non-dyslexic subgroup.
It is important to emphasize that the purpose of the Dyslexia Index Profiler is not to explicitly identify dyslexia in students, although a subsequent project might explore the feasibility of developing the profiler as such. The purpose of the Profiler has been to find students who present dyslexia-like study profiles such that these students' academic confidence could be compared with that of students who have disclosed an identified dyslexia - hence addressing the key research question relating to whether levels of academic confidence might be related to an individual being aware of their dyslexia or dyslexia-like attributes. From this, conjecture about how levels of academic confidence may be influenced by the dyslexia label may be possible.
Analysis and results
A detailed presentation about the methods used to analyse the data and the reasons for using those processes is provided, which includes a reflective commentary on the researcher's learning development in statistical processes where this adds value to the methods description. It is recognized that even though this is a doctoral level study, the level of statistical analysis that is used has had to be within the researcher's grasp both to properly execute and to understand outputs sufficiently to relate these to the research hypotheses. Invaluable in achieving these learning and research processing outcomes has been firstly a good understanding of intermediate-level statistical analysis, a degree of familiarity with the statistical analysis software application, 'SPSS' and much credit is also given to the accompanying suite of SPSS statistical analysis tutorials provided by Laerd Statistics online, which it is felt has both consoidated the researcher's existing competencies in statistical processes as well as providing a valuable self-teach resource to guide the understanding and application of new analysis tools and procedures.
Recall that the aim of the enquiry is to determine whether statistically significant differences exist between the levels of Academic Behavioural Confidence (ABC) of the three, principal research subgroups. The key, statistical outputs that have been used to establish this are the T-test for differences between independent sample means together with Hedges' 'g' effect size measures of difference. These are important outputs that can permit a broad conclusion to be drawn about significant differences in Academic Behavioural Confidence between the research subgroups, however a deeper exploration using Principal Component Analysis (factor analysis) has also been conducted on not only the results from data collected using the Academic Behavioural Confidence Scale but also of the Dyslexia Index metric which has enabled a matrix of T-test outcomes and effect sizes to be constructed. This has been a useful mechanism for untangling the complex interrelationships between the factors of academic behavioural confidence and the factors of dyslexia (as determined through the Profiler), and has contributed towards trying to understand which dimensions of dyslexia in students at university appear to have the most significant impact on their academic confidence in their studies.
![]()
[2760 / 63,074 (at 08 Jan 2018)]
Methodology
The research methodology for the enquiry is set out below as a workflow chronology as this serves to divide the reporting of how the research process has unfolded into ordered descriptions and justifications of the component parts of the project. In these, reference is made to pertinent methodology theory subsections where appropriate, and the extent to which, and reasons why this has been embraced or challenged. The workflow chronology is prefaced by a foreword which sets out the researcher's stance on the conventions of this part of a major, individual research enquiry which serves to underpin the chronology subsequently reported.
 Stance
To this researcher at least, it seems clear that most research studies in the Social Sciences, of which education research may be considered one branch, are incremental in nature, generally conservative in the research approach adopted and produce research outputs that may as much conflate knowledge as advance it. Social science does not appear to be as objective as 'regular' science. 'Social' might include or not, elements of cultural, ethnical, ethnographical, inter- (and intra?) personal factors or combinations of these. 'Societal' means as relating to human society and all of us in it and by its very nature is complex, multifactorial and often convoluted. Observing the activities of the world's peoples and the diversity of their functioning within it evidences this. Science concerns finding out more about the nature of the natural and social world through systematic methodology based on empirical evidence (Science Council, 2017). The methodology of social science research arguably attempts to unravel the ethnography of human attitudes, behaviour and interrelationships in ways which can, however, isolate behavioural, attitudinal or societal variables from their interrelated co-variables, devise methods to observe and analyse them and subsequently attempt to unravel the often unconvincing results that are difficult to interpret, gain meaning from or understand with a degree of conviction or certainty upon which agentic change may be proposed. Research outputs that are not change agents, however incremental this might be, are surely purposeless and offer little more than esoteric value to the community of academics and researchers undertaking their projects. No more can this be true than in the field of education and learning where cementing a transactional bond between research and teaching is surely an essential process in the advancement of the epistimological discourse.
We have learned from the overview above that Bandura's strong argument in his social cognition theory, decades in development, is that people should be viewed as self-organizing, proactive, self-reflective and self-regulating and not merely reactive organisms shaped by environmental forces or inner impulses. Law (2004) strongly argues that the methods that are devised to explore complexities such as these do more than merely describe them because these methods are contingent on the research 'trend' at the time and may as much influence and create the social realities that are being observed as measure them. This is because the conventionality of the 'research methods' processes that we are taught, supposedly fully considered and perfected after a century of social science 'tend to work on the assumption that the world is properly to be understood as a set of fairly specific, determinate and more or less identifiable processes' (ibid, p5). But the alternative (i.e. Law's) viewpoint is to challenge this global assumption on the basis that the diversity of social behaviours, interactions and realities is (currently) too complex for us to properly know (= the epistemological discourse), and hence argues that consequently, the shape of the research should accommodate the kind of fluidity in its methodology that is responsive to the flux and unpredictable outcomes of the mixtures of components and elements that are the focus of the enquiry. If this mindset is adopted, then in follows - so the argument goes - that the research output might be all that more convincing. This researcher is struck by how taking this approach to devising and actioning a research methodology seems analogous to Kelly's view of the societies of peoples whereby individuals integrate with their societies as scientists [sic] and the mechanisms through which this is accomplished is pursuant on constructing representational models of their world realities so that they can navigate courses of behaviour in relation to it (Kelly, 1955).
This introduction to the Research Methodology thus sets out the researcher's standpoint on the constraints of prescriptive research processes because to follow them especially creates a tension between such an obedient mindset and the context within which this enquiry is placed and shaped - that is, one that challenges conventional analyses of learning difference and strives to locate it along a spectrum of diversity which equally challenges the traditional acceptance of neurotypical as 'normal' (Cooper, 2006) and everything else as an aberration. This means that although at the outset a fairly clear sense of what needed to be discovered as the product of the enquiry was constructed, elements of grounded theory as a research methodology have been part of the research journey which at times it must be admitted, has drifted a little towards reflecting on the aetiologies of both dyslexia and academic confidence rather than merely reporting them. But it has also been important to regularly re-document these reflections on both product and process which, despite a tentative acceptance of the Popkewitzian argument that research is more than the dispassionate application of processes and instruments because it needs to embrace the underlying values and shared meanings of the research community within which it is located (Popkewitz, 1984), in the field of dyslexia research, consensus about the nature and origins of the syndrome remains as yet a distant objective - as outlined at the top of this paper - an irony that flies in the face of, for example, Rotter's strongly argued proposition that the heuristic value of a construct is [at least] partially dependent on the precision of its definition (1990, p489).
Thus despite the indistinctness of shape and character that surrounds the dyslexia syndrome, the research design has tried hard to retain focus on the primary objective which has been to evidence that students with unidentified dyslexia-like profiles have a stronger sense of academic confidence than identified dyslexic students, and has attempted to develop an enquiry that traces a clear path through the somewhat contentious fog that is dyslexia research.
[975 /63,074 (at 08 Jan 2018))]
 Workflow chronology
Key steps in the workflow chronology are marked by learning and research process landmarks that have determined the final architecture of the project. This workflow chronology identifies and documents how these have influenced this enquiry and aims to present firstly how the researcher's interest in the impact of dyslexia on learning at university was kindled by learning practitioner experience, and as the project has progressed, how key realizations based on a better understanding of theory and careful reflection on how it has reshaped thinking migrated the research agenda onto a slightly different track:
- The preceeding small-scale enquiry:
The legacy of outcomes from the researcher's preceeding Masters' dissertation (Dykes, 2008) has had a significant impact on the development of this current project. As a preceeding study, this small-scale enquiry within the dyslexic student community at a UK university was interested in understanding why some students with dyslexia were strong advocates of the learning support value provided by a dedicated learning technology suite staffed by dyslexia and disability specialists evidenced through their making frequent use of the suite and services throughout their time at university. Whereas at the same time, others with apparently similar student profiles appeared to be of the opposite disposition as these students rarely visited the technology suite or contacted the staff despite initially registering for access to the resources and services. It was thought that this disparity might, in part at least, be due to differences in the attitudes and feelings of students with dyslexia to their own dyslexia but particularly their perceptions about how it impacted on their access to, and their engagement with their learning at university. The study attempted to reveal these differences through exploration of (academic) locus of control as a determining variable by discriminating research participants into 'internalizers' or 'externalizers' as informed by the theories and evaluative processes widely acreditted to Rotter (1966, 1990). The hypothesis being considered was that students who did not use the learning technology suite and support services were likely to be internalizers whilst those who were regular 'customers' and frequently requested learning support from the staff, likely to be externalizers. This was formulated out of an extrapolation of the literature reviewed which suggested that externalizers were likely to be significantly more reliant on learning support services to help with and guide their studies in comparison to internalizers, who typically presented the more independent learning approaches generally observed amongst the wider student community. It was expected that this would be related to their attitudes and feelings about their dyslexia. As a member of staff of the suite at the time, privileged access to computer workstation log-in credentials was granted for the purposes of the research and this was used to determine which dyslexic students were frequent users of the service and which were not. Through a process of eliminating conflating variables, the research-participant base was established which eventually provided a sample size n=41 of which 26 were regular student users of the service and 15 were not. Data was collected through a self-report questionnaire which asked participants to rate their acquiscence using Likert-style responders to a selection of statements about learning and study preferences and about their feelings towards their dyslexia.
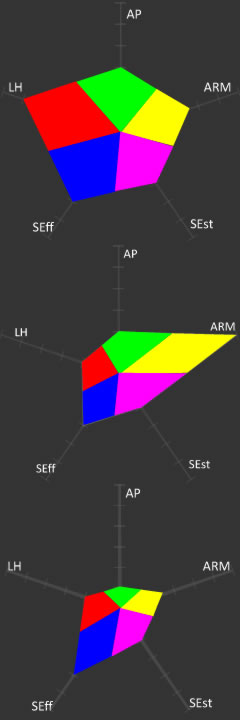
 By deconstructing academic locus of control into factors and structuring the questionnaire statements accordingly, some small but significant differences between student profiles did emerge after the data was analysed although overall, the results were inconclusive. However a highly significant output of the study was the development of what were termed at the time, Locus of Control Profiles. An example of the profiles generated from three respondents' data is shown (right). These were diagrams that represented the numerical conversion of each participant's responses to elements of the data collection questionnaire that were then aggregated into 5 distinct factors that the literature had shown were often associated with locus of control. These factors were attempting to measure respectively: Affective Processes, Anxiety regulation and Motivation, Self-Efficacy, Self-Esteem, and Learned Helplessness and each axis of the profile diagrams represented each of these factors. Due to the methods used to code the data collected from this section of the questionnaire, the magnitude of the area of the polygons generated in these profile diagrams represented the degree of internal locus of control presented by each participant. Greater areas represented higher levels of internal locus of control. Hence it was possible to differentiate internalizers from externalizers given boundary values which, it must be admitted now, were somewhat arbitrarily determined, but which nevertheless worked at the time and enabled an analysis process of sorts to be completed.
The factors emerged out of the literature review of the enquiry which had referred to many studies where levels of these constructs in learners with dyslexia were observed to have been siginificantly different than typically seen in non-dyslexic individuals (eg: Kerr, 2001, Burden & Burdett, 2005, Humphrey & Mullins, 2002, Riddick et al, 1999, Burns, 2000, Risdale, 2005). The literature also appeared to be showing that dyslexic individuals were more likely to be externalizers than internalizers in this locus of control context (eg: Bosworth & Murray, 1983, Rogers & Saklofske, 1985) because these individuals perceived, accurately or not, that their dyslexia would naturally put them at a learning disadvantage, not least due to their perception of their dyslexia as a learning disability rather than a learning difference in contemporary learning environments and therefore they would need additional support and resources in order to engage with their curricula on a more equal footing to their non-dyslexic peers. Originally the profiles were devised as a means to visually interpret and find meaning in the complex data that the enquiry had collected. No other studies had been found that presented multi-factoral outputs in a similar way and so in this respect, this portrayal of results in this way was highly innovative. On reviewing these individual participant-response profiles collectively, it was clear that they could be sifted into groups determined as much by striking similarities as by clear contrasts between them. The limitations of the enquiry recognized that there was much more information contained in these profile diagrams and their groupings than could be analysed and reported at the time and that these could be part of a further research project. It was also identified that a greater understanding of the relationships between the 5 factor constructs and locus of control and how these related to dyslexia in comparison to learners with no dyslexia was a necessary prerequisite for further work. It was also documented that an equally greater appreciation of 'due scientific process' would also be required for a later project especially in statistical analysis processes for example, gaining an understanding of what is now known to the researcher as principal component analysis. Despite this, it was recognized that the data generated through the self-report questionnaire were non-parametric, indeed with Likert-style attitudinal statements presented to participants with just two anchor-point choices - 'I generally agree with ...' or 'I generally disagree with...', the gradation of the data collected was extremely coarse. Clearer planning for the questionnaire design may have led to finer finer anchor-point gradings which would have facilitated a more cogent statistical argument to support the enquiry outcomes. Nonetheless, when this data was coded so that statistical analysis was possible, the non-parametric nature of the data collected was recognized, leading to use of the Mann-Whitney U and Kolgorov-Smirnoff Z tests for significant differences between medians. It is of no surprise therefore, especially with hindsight and with the researcher's more recently acquired statistical competencies, that the outcomes of the analysis were inconclusive. But the project did uncover interesting realities about the feelings and attitudes of students with dyslexia to their learning at university and worth reporting amongst these were statistically significant differences between the attitudes of 'internalizers' and 'externalizers' to their perceptions of the intensity of study required to match the academic performance of their non-dyslexic peers, and also about their feelings about the university's provision for the perceived uniqueness-of-need of students with dyslexia. Also of significant value were the sometimes quite heartfelt confessions of frustration, embarrassment and feelings of misunderstood expressed by many of the respondents, and also in relation to the institutional expectations to seek support to ameliorate study difficulties and challenges which actually increased study burdens rather then reduced them, especially in relation to time management. For example:- "I did not use dyslexia support at all last year ... [I] find the extra time in having to organize dyslexia support well in advance is not helpful as I would much prefer to ask for help as and when I have a problem" [respondent #28, Dykes, 2008, p85]
- "I am unable to use study support sessions as I am already finding it hard to keep up with the course and don't have time" [respondent #34, ibid, p88]
- "Going for help with studies takes up more of my time when i'm already struggaling with too much work and not enough time and it rarely helps as I can't explain why I'm struggaling, otherwise I would have just done it in the first place ... [and] all the forms assosated with getting help or reimbursement for books etc means that I keep putting [it] off - forms are something I am daunted by" [respondent #20, ibid, p98]
Thus is has been that enquiry background that has fuelled this current study notably through three, lasting impression of this earlier small-scale enquiry which emerged. The first was that in this higher education context at least, it seemed that as many students with identified dyslexia appeared to be at ease with the challenges of their studies as were those who were burdened with them and struggled (Dykes, 2008). This was in part demonstrated by a clear distinction between students who appeared ambivalent towards the additional support provisions that they had won through their Disabled Students' Allowance, sometimes citing these as not really necessary and evidenced in part by a significant lack of interest in taking advantage of training opportunities for the assistive technologies that they had been provided with to make studying easier for them, and those who presented quite the opposite. A similar result has been reported in another study where more than half of the 485 university students with dyslexia that were surveyed indicated that they had not taken up the assistive technology training that they had been offered although the reasons for this were not explored in detail with no distinction being made between training on hardware and training on software or assistive technology applications (Draffen et al, 2007). A later study amongst disabled students at the same institution (which coincidentally was also this researcher's own university) also uncovered a significant proportion of participants in the research cohort not taking up these training opportunities, citing time constraints, the burdensome nature of training regimes or the lack of contextual relevance to their studies as some of the reasons (Seale et al, 2010). A significant and possibly related factor may also be expressions of feelings of guilt about being given expensive hardware such as laptops and other devices that some dyslexic students felt they should not be entitled to because they did not consider themselves to be learning disabled and therefore considered that this additional support that they did not feel that they really needed might be giving them an unfair advantage over their peers as a result (Dykes, 2008).
The second feature that emerged from the earlier study which has impacted on the research methodology of this current project was evidence of a significant variability in attitudes towards their own dyslexia expressed by students in the earlier survey which appeared to be as much related to wide range of dyslexia 'symptoms' presented and students' perceptions of the relevance of these to their studies, as to other psychological factors such as self-esteem, academic self-efficacy and learned helplessness, collectively reflecting either a generally positive or negative approach towards the challenges of study at university - hence the interest in relating these factors to the degree of internal or external locus of control. The ways in which this has influenced the current research process has firstly been to flag up the complexity of the dyslexia syndrome and hence how challenges in clearly establishing what dyslexia means at university conflate dyslexia research paradigms; and secondly how complex, psycho-educational factors that affect every individual's learning behaviours and attitudes to their studies can be teased out into identifiable variables or dimensions that can be somehow measured and thus are comparable across research subgroups.
The third factor that has influenced and strongly motivated this current project has been the significant proportion of student respondents in the earlier study who strongly expressed their feelings that their dyslexia was about much more than writing challenges and poor spelling, and also how being differentiated from other learners had impacted negatively and had lasting effects.- "Dyslexia is seen too much as a reading and writing disorder ... I am just not hard wired in [the same] way [as others]. I just end up feeling stupid 'cos I just don't get it" [respondent #12, Dykes, 2008, p95]
- "I find searching databases and getting started on writing especially difficult" [respondent #34, ibid, p88]
- "I avoid using computers at university as they are not set up the same as mine at home and I find it confusing" [respondent #19, ibid, p109]
- "My spelling and reading sometimes gets worse when I think about dyslexia. I get annoyed with the tact that people can blame bad spelling on dyslexia" [respondent #11, ibid, p82]
- "I am not sure dyslexia is real because I believe everyone, if given the chance to prove it, could be a bit dyslexic. So perhaps my problem is that I am not as intelligent as others, or that my lack of confidence from an early age decreased my mental capability" [respondent #9, ibid, p94]
- "In my academic studies I have always had good grades but never found it easy to concentrate on my work" [respondent #27, ibid, p100]
- "... I will be thinking of one word but write a completely different word, for example I will be thinking 'force' but write 'power' ... I'm obviously cross-wired somewhere" [respondent #33, p101]
- "When I do not understand, most people think the written word is the problem but [for me] it is the thought process that is different" [respondent #41, ibid, p128]
- "I was separated all the time [in primary school] and made out to be different. I feel this wasn't the best way to deal with me" [respondent #39, ibid, p103]
- Defining dyslexia: the professional practitioners' view:
An outcome of the early stages of the literature review on dyslexia was an emerging unease about the lack of consensus amongst researchers, theorists and practitioners about how it should be defined. Having little recourse to a consensual definition about dyslexia was felt to be an obstacle in the research design, not least as it was clear that researchers and theorists tended to underpin their reports with a definition of dyslexia. It was felt that to conduct a research study about dyslexia in the absence of a universally agreed definition of what it is could be problematic and it was recognized that others had expressed a similar disquiet, in some cases constructing alternative theories to resolve the issue of definition discrepancies (eg: Frith, 1999, 2002, Evans, 2003, Cooper, 2006, Armstrong, 2015). Some of these have been referred to above but in summary, what seems to be emerging from the continued debate is that first of all, adherents to the deficit definitions which have traditionally been the preserve of clinicians who diagnose dyslexia have been numerous amongst earlier research and hence, this polarizes the research outcomes into alignment with this definition perspective. Secondly, the social constructivist model has encouraged the egress of 'differently-abled' as a definition standpoint which has gained in research popularity not least driven by inclusion agendas. Lastly, an increasing research narrative is supporting the argument that defining dyslexia is elusive to the extent that the label is unhelpful and laden with such stigma as to be academically counter-productive.
This difficulty has been discussed above, however a practical outcome of this concern was an interest in exploring how dyslexia is framed in professional practice. The led to the development and subsequent deployment of a small-scale sub-enquiry, in fact more of a 'straw poll' given its limited methodological underpinnings, that aimed to construct a backdrop of contemporary viewpoints from amongst dyslexia support practitioners about how dyslexia is defined in their worlds. There are precedents for an enquiry that tries to explore professionals' knowledge about dyslexia. Bell et al (2011) conducted a comparative study amongst teachers and teaching assistants in England and in Ireland who have professional working contact with students with dyslexia to explore how teachers conceptualize dyslexia. The research asked teachers and teaching assistants to describe dyslexia as they understood it and the data collected was categorized according to Morton & Frith's causal modelling framework that defines dyslexia as either a behavioural condition, a cognitive one or of biological origin (Morton & Frith, 1995). Their paper highlighted concerns that the discrepancy model of dyslexia - that is, where the difficulties are assumed to be intrinsic to the learner - persisted amongst practitioners, where discrepancy criteria were more frequently used to identify learners with dyslexia rather any other category or criterion (ibid, p185). Significant in Bell's study was an acknowledgement of the wide-ranging spectrum of characteristics associated with dyslexia and learning and hence, the importance of developing highly individualized teacher-learner collaborations if students with learning differences are to be fairly accommodated in their learning environments. Emerging from this was the call for better teaching training and development that enabled professionals to gain a greater understanding of the theoretical frameworks and most up-to-date research surrounding dyslexia and how it can be both idenfitied, formally or otherwise, and subsequently embraced in learning curricula. Soriano-Ferrer & Echegaray-Bengoa (2014) attempted to create and validate a scale to measure the knowledge and beliefs of university teachers in Spain about developmental dyslexia. Their study compiled 36 statements about dyslexia such as 'dyslexia is the result of a neurological disorder', 'dyslexic children often have emotional and social disabilities', 'people with dyslexia have below average intelligence' and 'all poor readers have dyslexia'. Respondents were asked to state whether they considered each statement about dyslexia to be true, false or that they did not know. Unfortunately their paper made no mention of the resulting distribution of beliefs, merely claiming strong internal consistency reliability for their scale. A similar, earlier (and somewhat more robust) study also sought to create a scale to measure beliefs about dyslexia with the aim of informing recommendations for better preparing educators for helping dyslexic students (Wadlington & Wadlington, 2005). The outcome was a 'Dyslexia Belief Index' which indicated that the larger proportion of research participants, who were all training to be or already were education professionals (n=250), held significant misconceptions about dyslexia. Similar later work by Washburn et al (2011) sought to gauge elementary school teachers' knowledge about dyslexia, using a criteria that claimed that 20% of the US population presents one or more characteristics of dyslexia. Other studies which also used definitions of dyslexia or lists of characteristics of dyslexia were interested in attitudes towards dyslexia rather than beliefs about what dyslexia is (eg: Honrstra et al, 2010, Tsovili, 2004).
Thus it was felt approriate to echo Bell's (op cit) interest and attempt to determine the current viewpoint of professional practitioners by exploring their alliances with the some of the various definitions of dyslexia. 'Professional practitioners' are taken as academic guides, learning development tutors, dyslexia support tutors, study skills advisers and disability needs assessors but the enquiry was scoped broadly enough to include others who work across university communities or more widely with dyslexic learners. Given that the definition of dyslexia may be considered as 'work in progress' it is not unreasonable to suppose that an academic researcher may use one variant of the working definition of dyslexia in comparison to that applied by a disability needs assessor or a primary school teacher for instance. Hence it was felt that finding out the extent to which dyslexia is framed according to the domain of functioning of the practitioner would provide a useful, additional dimension to this project's attempt to understand what dyslexia is. Some existing, recent studies report similar attempts to explore the meaning of dyslexia amongst practitioners.
10 definitions of dyslexia were sourced that tried to encompass a variety of perspectives on the syndrome which were built into a short electronic questionnaire and deployed on this project's webpages (see Appendix # and available online here). The questionnaire listed the 10 definitions in a random order and respondents were requested to re-order them into a new list that reflected their view of them from the 'most' to 'least' appropriate in their contemporary context. The sources of the 10 definitions were not identified to the participants during completion of the questionnaire because it was felt that knowing who said what may introduce some bias to answers. For example, practitioners may align their first choice with the definition attributes to the British Dyslexia Association (which was one of the sources) more out of professional/political correctness than according to their genuine view. Conversely, a respondent may dismiss the definition attributed to a TV documentary as unscientific because this may be perceived as an unscientific or potential biased source. On submission of the questionnaire the sources of all of the definitions were revealed and participants were told that this would occur in the preamble to the questionnaire. If was felt that curiosity about sources may be a contributory motivating factor to participate. Also provided in the questionnaire was a free-text area where respondents were able to provide their own definition of dyslexia if they chose to, or add any other comments or views about how dyslexia is defined. Additionally, participants were asked to declare the professional role and practitioner domain - for example 'my role is: 'a university lecturer in SpLD or a related field' '. The questionnaire was only available online and was constructed using features of the newly available HTML5 web-authoring protocols which enabled an innovative 'drag-drop-sort' feature. The core section that comprises the definitions and demonstrates the list-sorting functionality is below.
It was distributed across dyslexia forums, discussion lists and boards. and was also promoted to organizations with interest in dyslexia across the world, who were invited to support this 'straw poll' research by deploying it across their own forums or blogs or directly to their associations' member lists. Although only 26 replies were received, these did include a very broad cross-section of interests ranging from disability assessors in HE to an optometrist.
Although a broad range of definitions was sought it is notable that 8 out of the 10 statements used imply deficit by grounding their definitions in 'difficulty/difficulties' or 'disorder', which is indeed a reflection of the prior and prevailing reliance on this framework. With hindsight, a more balanced list of definitions should have been used, particularly including those pertinent to the latest research thinking which at the time of the questionnaire's construction had not been fully explored. The relatively positive definition #5, that of the British Dyslexia Association, which recognizes dyslexia as a blend of abilities and difficulties hence marking a balance between a pragmatic identification of the real challenges faced by dyslexic learners and a positive acknowledgement of many of the positive, creative and innovative characteristics frequently apparent in the dyslexic profile, was selected and placed in first, second or third place by 16 respondents with 12 of those placing it first or second. This only narrowly beat definition #8, noting dyslexia principally as a ‘processing difference’ (Reid, 2003) which was placed in first, second or third place by 14 respondents, also with 12 of those placing it in first or second place. Interestingly, this definition #8 beat the BDA’s definition for first place by 6 respondents to 5. The only other definition being selected and placed first by 6 respondents was definition #9 which characterizes dyslexia (quite negatively) with a ‘disability’ label, this being the only definition to include this in its wording indicating its origination in the USA where the term ‘learning disability’ is more freely used to describe dyslexia.
So from this relatively cursory inspection of the key aspects of respondents’ listings overall, it seems fairly evident that a clear majority of respondents align their views about the nature of dyslexia with both the that of the British Dyslexia Association and with that of an experienced practitioner, researcher and writer Gavin Reid, (2003), whose work is frequently cited and is known to guide much teaching and training of dyslexia ‘support’ professionals. However let us briefly consider some of the ways in which these results are dispersed according to the professional domains of the respondents:
Of the three results received from university lecturers in SpLD, two placed the BDA’s definition of a ‘combination of abilities and difficulties…’ in first position with the third respondent choosing just the definition describing dyslexia as a specific learning disability. 7 respondents described their professional roles as either disability/dyslexia advisors or assessors by which it is assumed these are generally non-teaching/tutoring roles although one respondent indicated a dual role in being a primary teacher as well as an assessor. None of these respondents used the BDA’s definition as their first choice, with two not selecting it at all. Of the remaining five, this definition was either their second or third choice. Two of these respondents put definition #8, ‘a processing difference…’ in first place with three others choosing definition 9, ‘a specific learning disability’ to head their list. Perhaps this is as we might expect from professionals who are trying to establish whether an individual is dyslexic or not because they have to make this judgment based on ‘indications’ derived from screenings and tests which are comprised of intellectual and processing challenges particularly designed to cause difficulty for the dyslexic thinker. This is central to their identifying processes. Although the professionalism and good intentions of assessors and advisors is beyond doubt, it might be observed that professional conversancy with a ‘diagnostic’ process may generate an unintentional but nevertheless somewhat dispassionate sense of the ‘learning-related emotions’ (Putwain, 2013) that might be expected in an individual who, most likely given a learning history peppered with frustration, difficulties and challenges, has now experienced an ‘assessment’ that, in the interests of ‘diagnosis’, has, yet again, spotlighted those difficulties and challenges. It is hard to see how such a process does much to enhance the self-esteem of the individual who is subjected to it. This is despite such trials being a necessary hurdle for determining eligibility for access to specialist support and ‘reasonable adjustments’ which, it will be claimed, will then ‘fix’ the problem. The notion of the impact of the identifying process is discussed a little more below.
One respondent was an optometrist ‘with a special interest in dyslexia’ who selected just one definition in their list, this being #9, ‘a specific learning disability…’ but additionally provided a very interesting and lengthy commentary which advocated visual differences as the most significant cause of literacy difficulties. An extensive, self-researched argument was presented, based on an exploration of ‘visual persistence’ and ‘visual refresh rates’. The claimed results showed that ‘people who are good at systems thinking and are systems aware are slow, inaccurate readers but are good at tracking 3D movement, and vice versa’, adding that ‘neurological wiring that creates good systems awareness [is linked with] slow visual refresh rates and that this results in buffer overwrite problems which can disrupt the sequence of perceived letters and that can result in confusion in building letter to sound associations’. Setting aside the more immediate interest in this study, without recourse to its argument and conclusions being tested through peer-review (which do not seem apparent) at the very least this may be an example of a research perspective that is in clear alignment with the domain of functioning of the researcher and not wholly objective, although this is not to cast unsubstantiated aspersions onto the validity of the research. This respondent was also of the opinion that none of the definitions offered were adequate (actual words used not repeatable here) with some particularly inadequate, commenting further that ‘I do not know what it would mean to prioritize a set of wrong definitions’ - a point which distills much of the argument presented in my paper so far relating to issues of definition impacting on research agendas.
With the exception of Cooper’s description of dyslexia being an example of neuro-diversity rather than a disability, difficulty or even difference, definitions used by researchers and even professional associations by and large remain fixed on the issues, challenges and difficulties that dyslexia presents when engaging with the learning that is delivered through conventional curriculum processes. This approach compounds, or certainly tacitly compounds the ‘adjustment’ agenda which is focused on the learner rather than the learning environment. Although it is acknowledged that more forward-looking learning providers are at least attempting to be inclusive by encouraging existing learning resources and materials to be presented in more ‘accessible’ ways – at least a pragmatic approach – this is still not grasping the nettle of how to create a learning environment that is not exclusively text-based. I make no apologies for persistently coming back to this point. - Report on: Building on 2. above, how lit review at least appeared to identify common characteristics of dyslexia that appear widely apparent in dyslexic university students. Conduct a second straw-poll to dyslexia learning support professionals to try to determine the incidence of these characteristics amongst their student cohorts; CONTENT HERE
- Report on: how 2. to 4., in conjunction with a lack of confidence in any of the current tools for identifying dyslexia in higher education (following an lit review of how these tend to have been used) might be used in this enquiry not least due to regard for maintaining clean ethical protocols aside from the focus of these tools being largely on literacy difficulties being used as the identifying markers for dyslexia; hence how this led to the development of the Dyslexia Index Profiler. CONTENT HERE
- Measuring academic confidence using the Academic Behavioural Confidence Scale? CONTENT HERE
All of these considerations were welded together into a research design for this current project which proposed at the outset to firstly develop the profile visualizations of the prior study into a discriminator for identifying dyslexia-like characteristics amongst apparently non-dyslexic students, and secondly to adopt Sanders et al (2003, 2006) established Academic Behavioural Confidence Scale as a mechanism for exploring the differences in academic behaviour between students with dyslexia, students with no dyslexia and most importantly, students with previously unidentified dyslexia-like profiles. As reported elsewhere in this thesis, the ABC Scale has been used in a number of recent research studies to investigate the causes for differences in students' study behaviours but to date, this process is not known to have been applied specifically to explore the impact of dyslexia on academic confidence. The decision to make use of the ABC Scale emerged out of reflecting on the resonance that the construct of 'academic confidence' had with the differences observed in the earlier study between dyslexic students who expressed a general confidence in tackling their studies at university compared with those others who presented low levels of self-esteem and academic self-efficacy which correlated negatively with levels of study anxiety, defeatism, learned helplessness and, to a lesser extent, academic procrastination. This led to the supposition that this disparity may be a function of how individuals' were incorporting their dyslexic identity into their study identify, with those who were more comfortable with their dyslexic self being part of who they are presenting more positive approaches towards their studies than others who strongly perceived their dyslexia as a disabling characteristic of their study identity and to which they tended to attribute their low levels of self-esteem and self-confidence in tackling academic challenges. Much of this earlier thinking has been grounded in Burden's extensive research with dyslexic adolescents which collectively was one of the few research interests that took individuals' feelings and attitudes to their dyslexia as the main focus - that is, the affective dimension of dyslexia (Burden, 2008a, Burden, 2008b, Burden & Burdett, 2005, Burden & Burdett, 2007). The Myself-As-A-Learner Scale (MALS) (Burden, 2000), developed out of his research into dyslexic teenagers' approaches to their learning which in particular looked at attitudinal differences within learners attending a special school which specifically focused on supporting dyslexia, was designed to evaluate students' academic self-concept as a means to understand more about how learners' self-identity impacted on academic engagement and ultimately, attainment. Key to this, has been the broad use of confidence as a characterizing attribute. The scale has been used in a number of more recent studies amongst learners where dyslexia was not the focus of the enquiries nor was the condition mentioned but these studies were ones which recognize that academic self-concept and the affective dimensions that accompany it has traditionally been regarded amongst researchers to have less significance in relation to academic attainment than the concept of intelligence. Amongst these has been a longitudinal study which was interested in changes in students MALS scores as they progressed through secondary education (Norgate et al, 2013), a project which was exploring the relationships between academic self-concept, classroom test performance and causal attribution for achievement (Erten & Burden, 2014) and an interesting study which looked at how socio-emotional characteristics of dyslexic children were modified during their temporary extraction from mainstream teaching settings into specialist learning units to support enhancing literacy skills (Casserly, 2012). Burden took the MALS as a starting point for further development with many of the conceptual underpinnings surfacing in a much more focused metric, the Dyslexia Identity Scale, (Burden, 2005a). This evaluator was more concerned with finding out more about the affective dimensions of dyslexia and how these contributed to a dyslexic learner's sense of 'self'. Other researchers were similarly interested in the 'dyslexic self', notably Pollack (2005) whose interest was more with dyslexia in higher education contexts and how institutional perceptions and understandings about dyslexia should be challenged in the light of agendas promoting greater inclusivity and accessibility, suggesting that a reframing of teaching and learning approaches to be more properly aligned with this social justice agenda were long overdue. [more here?]
Reflecting on the research methodology that supported the enquiry at that time, hindsight suggests that it would have benefitted from a more robustly developed framework based on theoretical underpinnings that could have been better understood at that time although the high final grade for the dissertation indicated that it had nevertheless presented an understanding of the relevant concepts and application of theory to method that was broadly appropriate for that level of study.
![]()
Measuring academic agency through Academic Behavioural Confidence
Sed in consectetur leo, quis venenatis velit. Vivamus ipsum ante, rutrum eu urna consectetur, tempus dapibus augue. Nulla facilisi. Nullam quis orci sed dui ultricies finibus eu ut libero. Quisque in tempus lectus, et fermentum ligula. Nullam ullamcorper aliquam elit, at rutrum eros semper ut. Curabitur ut malesuada libero.
[5834 / 67,809 (at 30 Jan 2018)]
![]()
Measuring dyslexia - existing evaluators and identification processes
Sed in consectetur leo, quis venenatis velit. Vivamus ipsum ante, rutrum eu urna consectetur, tempus dapibus augue. Nulla facilisi. Nullam quis orci sed dui ultricies finibus eu ut libero. Quisque in tempus lectus, et fermentum ligula. Nullam ullamcorper aliquam elit, at rutrum eros semper ut. Curabitur ut malesuada libero.
![]()
Development of a new profiling tool: Dyslexia Index (Dx)
This metric has been devised and developed to satisfy the criteria above. It has been constructed following review of dyslexia self-identifying evaluators such as the BDA's Adult Checklist developed by Smythe and Everatt (2001), the original Adult Dyslexia Checklist proposed by Vinegrad (1994) upon which many subsequent checklists appear to be based, and the much later, York Adult Assessment (Warmington et al, 2012) which has a specific focus as a screening tool for dyslexia in adults and which, despite the limitations outlined earlier, was found to be usefully informative. Also consulted and adapted has been work by Burden, particularly the 'Myself as a Learner Scale' (Burden, 2000), the useful comparison of referral items used in screening tests which formed part of a wider research review of dyslexia by Rice & Brooks (2004) and more recent work by Tamboer & Vorst (2015) where both their own self-report inventory of dyslexia for students at university and their useful overview of other previous studies were consulted.
It is widely reported that students at university, by virtue of being sufficiently academically able to progress their studies into higher education, have frequently moved beyond many of the early literacy difficulties that may have been associated with their dyslexic learning differences and perform competently in many aspects of university learning (Henderson, 2015). However the nature of study at university requires students to quickly develop their generic skills in independent self-managed learning and individual study capabilities, and enhance and adapt their abilities to engage with, and deal resourcefully with learning challenges generally not encountered in their earlier learning histories (Tariq & Cochrane, 2003). Difficulties with many of these learning characteristics or 'dimensions' that may be broadly irrelevant or go un-noticed in children, may only surface when these learners make the transition into the university learning environment. Many students struggle to deal with these new and challenging learning regimes, whether dyslexic or not and this has seen many, if not most universities developing generic study-skills and/or learning development facilities and resources to support all students in the transition from managed to self-managed learning. Indeed, for many who subsequently learn of their dyslexia, gaining an understanding about why they may be finding university increasingly difficult, and even more so than their friends and peers, does not happen until their second or third year of study. One earlier research paper established that more than 40% of students with dyslexia only have their dyslexia identified during their time at university (Singleton et al, 1999) and given acknowledgement that widening participation and alternative access arrangements for entry to university in the UK has certainly increased the number of students from under-represented groups moving into university learning (Mortimore, 2013) although given higher participation in higher education generally it is the proportion rather than the number that might be a better indicator, it is nevertheless possible that this estimate remains reasonable, and might further suggest that many dyslexic students progress to the end of their courses remaining in ignorance of their learning difference, and indeed many also will gain a rewarding academic outcome in spite of this suggesting that their dyslexia, such that it may be, is irrelevant to their academic competency and indeed, has had little impact on their academic agency.
But there are many reasons why dyslexia is not identified at university and a more comprehensive discussion about this will be presented in the final thesis. However one explanation for this late, or non-identification may be because these more, 'personal management'-type dimensions of dyslexia are likely to have had little impact in themselves on earlier academic progress because school-aged learners are supervised and directed more closely in their learning at those stages. At university however, the majority of learning is self-directed, with successful academic outcomes relying more heavily on the development of effective organizational and time-management skills which may not have been required in earlier learning (Jacklin et al, 2007). So because the majority of the existing metrics appear to be weak in gauging many of the study skills and academic competencies, strengths and weaknesses of students with dyslexia that may either co-exist with persistent literacy-based deficits or have otherwise displaced them, this raised a concern about using any of these metrics per se, a concern shared by many educators working face-to-face with university students (eg: Chanock et al, 2010, Casale, 2013) where there has been a recent surge in calls for alternative assessments which more comprehensively gauge a wider range of study attributes, preferences and characteristics.
So two preliminary enquiries were developed that sought to find out more about how practitioners are supporting and working with students with dyslexia in UK universities with a view to guiding the development of the Dyslexia Index on the basis that grounding it in the practical experiences of working with students with dyslexia in university contexts could be a valuable alternative to basing the profiler on theory alone. The first enquiry aimed to find out more about the kind of working definition of dyslexia that these practitioners were adopting, results are reported on the project webpages and will be more deeply explored later with a full analysis presented in the final thesis. The second aimed to explore the prevalence of attributes and characteristics associated with dyslexia that were typically encountered by these practitioners in their direct interactions with dyslexic students at university on a day-to-day basis. The results of this second enquiry have been used as the basis for building the Dyslexia Index Profiler and are reported in the next section.
Construction of the Dyslexia Index (Dx) profiler
The Dyslexia Index (Dx) profiler forms the final 20-item Likert scale on the main research questionnaire for this project which has been deployed to students during the summer term of 2016. This final section of the main QNR addresses respondents to:
- 'reflect on other aspects of approaches to your studying or your learning history - perhaps related to difficulties you may have had at school - and also asks about your time management and organizational skills more generally.'
The bank of 20 'leaf' statements comprise the 18 statements from the baseline enquiry (as detailed below) plus two additional statements relating to learning biography:
- 'When I was learning to read at school, I often felt I was slower than others in my class';
- 'In my writing at school I often mixed up similar letters like 'b' and 'd' or 'p' and 'q'.
and these leaf statements are collectively preceded by the 'stem' statement: 'To what extent do you agree or disagree with these statements ...'. Respondents register their level of acquiesence using the input-variable slider by adjusting its position along a range from 0% to 100% with the value on the final position being presented in an output window. The complete main research questionnaire of which this metric comprises the final section, is available to view here.
Each respondent's results were collated into a spreadsheet, adjusted where specified (through reverse-coding some data, for example - details below) and the Dyslexia Index (Dx) is calculated as the weighted mean average of the input-values that the respondent set against each of the leaf statements. The final calculation generates a value between 0 < Dx < 1000. The process of weighting the input-value for each leaf statement arises from analysis of the data collected in the baseline enquiry whereby the weighting applied is derived from the mean average prevalence of each attribute, or 'dimension' of dyslexia that emerged from that data.
An attempt has been made to try choose the wording of the leaf statements carefully so that the complete bank has a balance of positively-worded, negatively-worded and neutral statements overall. There is evidence that to ignore this feature of questionnaire design can impact on internal consistency reliability although this practice, despite being widespread in questionnaire design, remains controversial (Barnette, 2000) with other more recent studies reporting that the matter is far from clear and requires further research (Weijters et al, 2010). A development of this Dyslexia Index Profiler will be to explore this issue in more depth.
A working trial of a standalone version of the Dyslexia Index profiler which produces an immediate Dx value is available here but which, it is stressed, has been created and published online initially to support this paper, although it is hoped that further development will be possible, most likely as a research project beyond this current study. So it must be emphasized that this is only a first-development profiler that has emerged from the main research questionnaire data analysis to date and has a slightly reduced, 16-item format. Details about how this has been developed will be presented in the final thesis as constraints in this paper prevent a comprehensive reporting of the development process here.
![]()
Baseline enquiry: collecting data about the prevalence of 'dimensions' of dyslexia
This tool aimed to collect data about the prevalence and frequency of attributes, that is, dimensions of dyslexia encountered by dyslexia support professionals in their interactions with dyslexic students at their universities. An electronic questionnaire (eQNR) was designed, built and hosted on this project's webpages, available here . A link to the eQNR was included in an introduction and invitation to participate, sent by e-mail to 116 of the UK Higher Education institutions listed on the Universities UK database. The e-mail was directed to each university's respective student service for students with dyslexia where this could be established from universities' webpages (which was most of them) or otherwise to a more general university enquiries e-mail address. Only 30 replies were received which was disappointing, although it was felt that the data in these replies was rich enough to provide substantive enough baseline data which could positively contribute to the development of the Dyslexia Index Profiler and hence it could incorporated into the project's main research questionnaire scheduled for deployment to students later on.
The point of this preliminary enquiry was twofold:
- by exploring the prevalence of attributes (dimensions) of dyslexia observed 'at the chalkface' rather than distilled through theory and literature, it was hoped that this data would confirm that the dimensions being gauged through the enquiry were indeed significant features of the learning and study profiles of dyslexic students at university. A further design feature of the enquiry was to provide space for respondents to add other dimensions that they had encountered and which were relevant. These are shown below together with comments about how they were dealt with;
- through analysis of the data collected, value weightings would be ascribed to the components of the Dyslexia Index Profiler when it was built and incorporated into the main research questionnaire. This was felt to be a very important aspect of this preliminary enquiry because it was an attempt to establish the relative prevalence of dimensions as it was felt that this could be a highly influential factor in determining a measure of dyslexia, this being the most important feature of the profiler so that it could be utilised as a discriminator between dyslexic and non-dyslexic students.
A main feature of the design of the eQNR, was to discard the conventionally-favoured Likert scale-item discrete scale-point anchors with input-range sliders to displace to enable respondents to record their inputs. The advent of this relatively new browser functionality has seen electronic data-gathering tools begin to use input-range sliders more readily following evidence that doing so can reduce the impact of input errors, especially in the collection of measurements of constructs that are representative individual characteristics, typically personality (Ladd, 2009), or other psychological characteristics. Controversy also exists relating to the nature of discrete selectors for Likert scale items because data collected through typically 5- or 7-point scales needs to be coded into a numerical format to permit statistical analysis. The coding values used are therefore arbitrary and coarse-grained and the controversy relates to the dilemma about using parametric statistical analysis processes with what is effectively non-parametric data - that is, it is discrete, interval data rather than continuous. (Brown, 2011, Carifio & Perla, 2007 & 2008, Jamieson, 2004, Murray, 2013, Norman, 2010, Pell, 2005). Through using input-range slider functionality, this not only addresses these issues because the outputs generated, although technically still discrete because they are integer values, nevertheless provide a much finer grading and hence may be more justifiably used in parametric analysis. This baseline enquiry also served the very useful purpose of testing the technology and gaining feedback about its ease of use to determine whether it was robust enough and sufficiently accessible to use in the in the project's main student-questionnaire later or should be discarded in favour of more conventionally constructed Likert scales items. Encouraging feedback was received, so the process was indeed included in the main research questionnaire deployed to students.
In this prelinimary enquiry 18 attributes or 'dimensions' of dyslexia were set out in the eQuestionnaire collectively prefixed by the question:
• 'In your interactions with students with dyslexia, to what extent do you encounter each of these dimensions?'
In the QNR, each Likert-style stem statement refers to one dimension of dyslexia. 18 dimensions were presented and respondents were requested to judge the frequency that each dimension was encountered in interactions with dyslexic students as a percentage of all interactions with dyslexic students. For example in the statement: "students show evidence of being disorganized most of the time" a respondent who judged that they 'see' this dimension in 80% of all their dyslexic student interactions would return '80%' as their response to this stem statement. It was anticipated that respondents would naturally dis-count repeat visitors from this estimate although to do so was not made explicit in the instructions as it was felt that this would over-complicate the preamble to the questionnaire. It is recognized that there is a difference between 80% of students being 'disorganized' and 'disorganization' being encountered in 80% of interactions with students. However it was felt that since an overall 'feel' for prevalence was the aim for the questionnaire, the difference was as much a matter of syntax as much as distinctive meaning and so either interpretation from respondents would be acceptable. Respondents were requested to record their estimate by moving each slider along a continuous scale ranging from 0% to 100% according to the guidelines at the top of each of the 18 leaf statements. The default position for the slider was set at 50%. With hindsight, it may have been better to have set the default position at 0% in order to encourage respondents to be properly active in responding rather than somewhat inert with some statements that were considered with ambivalence which may have been the case with the default set at 50%. This could only have been established by testing prior to deployment for which time was not available. Research to inform this is limited at present as the incorporation of continuous rating scales in online survey research is relatively new technology although the process is now becoming easier to implement and hence is attracting research interest (eg: Treiblmaier & Flizmoser, 2011).
The 18 leaf statements, labelled 'Dimension 01 ... 18' are:
- students’ spelling is generally very poor
- students say that they find it very challenging to manage their time effectively
- students say that they can explain things more easily verbally than in their writing
- student show evidence of being very disorganized most of the time
- in their writing, students say that they often use the wrong word for their intended meaning
- students seldom remember appointments and/or rarely arrive on time for them
- students say that when reading, they sometimes re-read the same line or miss out a line altogether
- students show evidence of having difficulty putting their writing ideas into a sensible order
- students show evidence of a preference for mindmaps or diagrams rather than making lists or bullet points when planning their work
- students show evidence of poor short-term (and/or working) memory – for example: remembering telephone numbers
- students say that they find following directions to get to places challenging or confusing
- when scoping out projects or planning their work, students express a preference for looking at the ‘big picture’ rather than focusing on details
- students show evidence of creative or innovative problem-solving capabilities
- students report difficulties making sense of lists of instructions
- students report regularly getting their ‘lefts’ and ‘rights’ mixed up
- students report their tutors telling them that their essays or assignments are confusing to read
- students show evidence of difficulties in being systematic when searching for information or learning resources
- students are very unwilling or show anxiety when asked to read ‘out loud’
It is acknowledged that this does not constitute an exhaustive list of dimensions and in the preamble to the questionnaire this was identified. In order to provide an opportunity for colleagues to record other, common (for them at least) attributes encountered during their interactions with students, a 'free text area' was included and placed at the foot of the questionnaire for this purpose. Where colleagues listed other attributes, they were also requested to provide a % indication of the prevalence. In total, an additional 24 attributes were reported with 16 of these indicated by just one respondent each. 2 more were reported by each of 6 further respondents, 1 more reported by each of 3 respondents and 1 more reported by 4 respondents. To make this clearer to understand, the complete set is presented below:
| Additional attribute reported | % prevalence | |||
| poor confidence in performing routine tasks | 90 | 85 | 80 | *n/r |
| slow reading | 100 | 80 | *n/r | |
| low self-esteem | 85 | 45 | ||
| anxiety related to academic achievement | 80 | 60 | ||
| pronunciation difficulties / pronunciation of unfamiliar vocabulary | 75 | 70 | ||
| finding the correct word when speaking | 75 | 50 | ||
| difficulties taking notes and absorbing information simultaneously | 75 | *n/r | ||
| getting ideas from 'in my head' to 'on the paper' | 60 | *n/r | ||
| trouble concentrating when listening | 80 | |||
| difficulties proof-reading | 80 | |||
| difficulties ordering thoughts | 75 | |||
| difficulties remembering what they wanted to say | 75 | |||
| poor grasp of a range of academic skills | 75 | |||
| not being able to keep up with note-taking | 75 | |||
| getting lost in lectures | 75 | |||
| remembering what's been read | 70 | |||
| difficulties choosing the correct word from a spellchecker | 60 | |||
| meeting deadlines | 60 | |||
| focusing on detail before looking at the 'big picture' | 60 | |||
| difficulties writing a sentence that makes sense | 50 | |||
| handwriting legibility | 50 | |||
| being highly organized in deference to 'getting things done' | 25 | |||
| having to re-read several times to understand meaning | n/r | |||
| profound lack of awareness of their own academic difficulties | *n/r | |||
| (* n/r = % not reported) | ||||
It is interesting to note that the additional attribute most commonly reported referred to students' confidence in performing routine tasks, by which it is assumed is meant 'academic tasks'. It was felt that this provided encouragement that the more subjective self-report, Academic Behavioural Confidence scale that is incorporated into the main research questionnaire would account for this attribute as expected, and that to factor the construct of 'confidence' into the Dyslexia Index Profiler would not be necessary. However this may be a consideration for the future development of the stand-alone Profiler in due course.
Data collected from the questionnaire replies was collated into a spreadsheet and in the first instance, simple statistics were calculated to provide the mean average prevalence for each dimension, together with the standard deviation for the dataset and the standard error so that 95% confidence intervals for the background population means for each dimension could be established to provide an idea of variability. The most important figure is the sample mean prevalence because this indicates the average frequency that each of these dimensions were encountered by dyslexia support professionals in university settings. For example, the dimension that was encountered with the greatest frequency on average, is 'students show evidence of having difficulty putting their writing ideas into a sensible order' with a mean average prevalence of close to 76%. The table below presents the dimensions according to the average prevalence which in itself presents an interesting picture of 'in the field' encounters and it notable that the top three dimensions appear to be particularly related to organizing thinking. A deeper analysis of these results will be reported in due course.
Interesting in itself as this data is, the point of collecting it has been to inform the development of the Dyslexia Index (Dx) Profiler to be included in the main research questionnaire and it was felt that there was sufficient justification to include all 18 dimensions into the Dx Profiler but that to attribute them all with an equal weighting would be to dismiss the relative prevalence of each dimension, determined from their rankings of mean prevalence shown in the table below. So by aggregating input-values assigned to each dimension in the Dx Profiler on a weighted mean basis it was felt that the result, as presented by the Dyslexia Index value, would be a more representative indication of any one respondent presenting a dyslexia-like profile of study attributes or not. Hence this may then be a much more reliable discriminator for sifting out 'unknown' dyslexic students from the wider research group of (declared) non-dyslexic students.
| dim# | Dyslexia dimension | mean prevalence | st dev | st err | 95% CI for µ |
| 8 | students show evidence of having difficulty putting their writing ideas into a sensible order | 75.7 | 14.75 | 2.69 | 70.33 < µ < 81.07 |
| 7 | students say that when reading, they sometimes re-read the same line or miss out a line altogether | 74.6 | 14.88 | 2.72 | 69.15 < µ < 79.98 |
| 10 | students show evidence of poor short-term (and/or working) memory - for example, remembering telephone numbers | 74.5 | 14.77 | 2.70 | 69.09 < µ < 79.84 |
| 18 | students are very unwilling or show anxiety when asked to read 'out loud' | 71.7 | 17.30 | 3.16 | 65.44 < µ < 78.03 |
| 3 | students say that they can explain things more easily verbally than in their writing | 70.6 | 15.75 | 2.88 | 64.84 < µ < 76.30 |
| 16 | students report their tutors telling them that their essays or assignments are confusing to read | 70.4 | 14.60 | 2.67 | 65.09 < µ < 75.71 |
| 2 | students say that they find it very challenging to manage their time effectively | 69.9 | 17.20 | 3.14 | 63.67 < µ < 76.19 |
| 17 | students show evidence of difficulties in being systematic when searching for information or learning resources | 64.3 | 19.48 | 3.56 | 57.21 < µ < 71.39 |
| 13 | student show evidence of creative or innovative problem-solving capabilities | 63.2 | 19.55 | 3.57 | 56.08 < µ < 70.32 |
| 4 | students show evidence of being very disorganized most of the time | 57.2 | 20.35 | 3.72 | 49.79 < µ < 64.61 |
| 12 | when scoping out projects or planning their work, students express a preference for looking at the 'big picture' rather than focusing on details | 57.1 | 18.00 | 3.29 | 50.58 < µ < 63.69 |
| 9 | students show evidence of a preference for mindmaps or diagrams rather than making lists or bullet points when planning their work | 56.7 | 17.44 | 3.18 | 50.32 < µ < 63.01 |
| 1 | students' spelling is generally poor | 52.9 | 21.02 | 3.84 | 45.22 < µ < 60.52 |
| 11 | student say that they find following directions to get to places challenging or confusing | 52.3 | 20.74 | 3.79 | 44.78 < µ < 59.88 |
| 14 | students report difficulties making sense of lists of instructions | 52.0 | 22.13 | 4.04 | 43.98 < µ < 60.09 |
| 15 | students report regularly getting their 'lefts' and 'rights' mixed up | 51.7 | 18.89 | 3.45 | 44.83 < µ < 58.57 |
| 5 | in their writing, students say that they often use the wrong word for their intended meaning | 47.8 | 20.06 | 3.66 | 40.46 < µ < 55.07 |
| 6 | students seldom remember appointments and/or rarely arrive on time for them | 35.7 | 19.95 | 3.64 | 28.41 < µ < 42.93 |
The graphic below shows the relative rankings of all 18 dimensions again, but with added, hypothetical numbers of interactions with dyslexic students in which any particular dimension would be presented based on the mean average prevalence. These have been calculated by assuming a baseline number of student interactions of 100 for each questionnaire respondent (that is, professional colleagues who responded to this baseline enquiry), hence generating a total hypothetical number of interactions of 3000 (30 QNR respondents x 100 interactions each). The graphic below shows the relative rankings of all 18 dimensions again, So for example, the mean average prevalence for the dimension 'students show evidence of having difficulty putting their writing ideas into a sensible order' is 75.7% based on the data collected from all respondents. This means that we might expect any one of our dyslexia support specialists to experience approximately 76 (independent) student interactions presenting this dimension out of every 100 student interactions in total. Scaled up as a proportion of the baseline 3000 interactions, this produces an expected number of interactions of 2271 presenting this dimension.
Complex and fiddly as this process may sound at first, it was found to be very useful for gaining a better understanding of what the data means. With hindsight, it may have enabled a clearer interpretation to have been made if the preamble to the questionnaire had very explicitly made clear that the interest was in independent student interactions to try to ensure that colleagues did not count the same student visiting on two separate occasions presenting the same dimension each time. It is acknowledged that this may be a limiting factor in the consistency of the data collected and mention of this has already been made above. We should note that this QNR has provided data about the prevalence of these 18 dimensions of dyslexia not from a self-reporting process amongst dyslexic students, but on the observation of these dimensions occurring in interactions between professional colleagues supporting dyslexia and the dyslexic students they are working with in HE institutions across the UK. The QNR did not ask respondents to state the number of interactions on which their estimates of the prevalence of dimensions were based over any particular time period, but based on how busy dyslexia support professionals in universities tend to be, it might be safe to assume that the total number of interactions on which respondents' estimates were based is likely to have been reasonable.
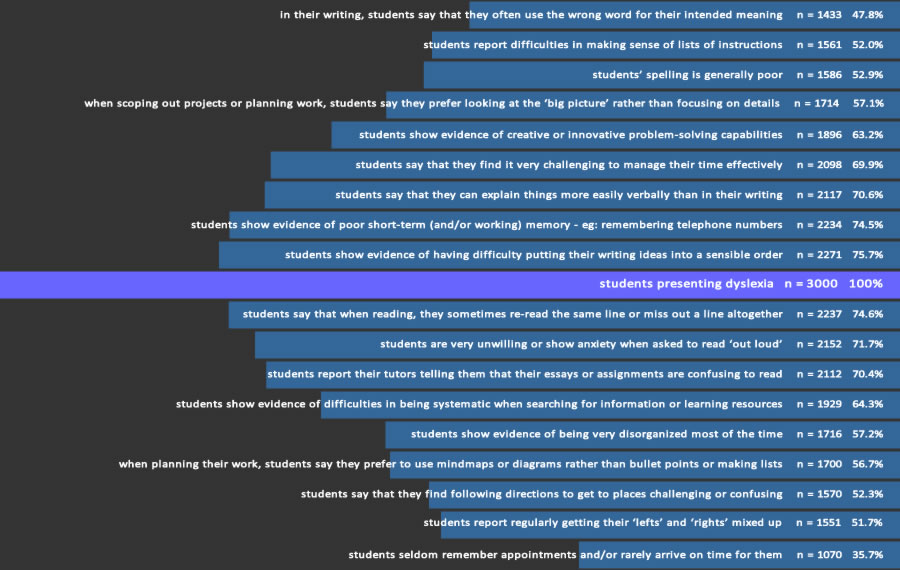
Another factor worthy of mention is that correlations between dimensions have been calculated to obtain Pearson Product-Moment Correlation Coefficient 'r' values. It was felt that by exploring these potential interlinking factors, more might be learnt about dimensions that are likely to be occurring together, which aside from being interesting in itself, understanding more about correlations between dimensions could, for example, be helpful for developing suggestions and guidelines for dyslexia support tutors working with their students. So far at least, no research evidence has been found that considers the inter-relationships between characteristics of dyslexia in university students and whether there is value in devising strategies to jointly remediate them during study-skills tutorial sessions.
Although at present, the coefficients have been calculated and scatter diagrams plotted to spot outliers and explore the impact that removing them has on r, a deeper investigation about what might be going on is another further development to be undertaken later. In the meantime, the full matrix of correlation coefficients together with their associated scatter diagrams is available on the project webpages here . Some of the linkages revealed do appear fascinating, for example, there appears to be a moderate positive correlation (r = 0.554) between students observed to be poor time-keepers and who also often get their 'lefts' and 'rights' mixed up; or that students who are reported to be poor at following directions to get to places appear to be observed as creative problem-solvers (r = 0.771). Some other inter-relationships are well-observed and unsurprising, for example, r = 0.601 for the dimensions relating to poor working memory and confused writing. Whilst it is fully understood thatcorrelation does not mean causation, nevertheless, time will be set aside to revisit this part of the data analysis as it is felt that there is plenty of understanding to be gained by exploring this facet of the enquiry more closely later.
Feeding these results into the construction of the Dx Profiler
In the main research questionnaire, the Dyslexia Index Profiler formed the final section. All 18 dimensions were included and were reworded slightly into 1st person statements. Respondents were requested to adjust the input-value slider to register their degree of acquiescence with each of the statements. The questionnaire's output submitted raw scores to the researcher in the form of an e-mail displaying data in the body of the e-mail but also as an attached .csv file. Responses were first collated into a spreadsheet which was used to aggregate them into a weighted mean average derived from the Preliminary Enquiry 2 as described above. Two additional dimensions were included to provide some detail about learning biography, one to gain a sense of how the respondent remembered difficulties they may have experienced in learning to read in early years, and the other about similar-letter displacement mistakes in their early writing:
- when I was learning to read at school, I often felt I was slower than others in my class
- In my writing at school, I often mixed up similar letters like 'b' and 'd' or 'p' and 'q'
It was felt that these two additional dimensions elicit a sufficient sense of early learning difficulties typically associated with the dyslexic child but which will, or are likely to have been mitigated in later years, especially amongst the population of more academically able adults who might be expected to be at university. These dimensions were not included in the baseline enquiry to dyslexia support professionals as it was felt that they would be unlikely to have knowledge about these aspects of a student's learning biography. The table below lists all 20 dimensions in the order and phraseology in which they were presented in the main research questionnaire, together with the weighting (w) assigned to each dimension's output value. It can be seen that the two additional dimensions were each weighted by a factor of 0.80 to acknowledge the strong association of these characteristics of learning challenges in early reading and writing with dyslexia biographies.
It should be noted, and in accordance with comments earlier, that some statements have also been reworded to provide a better balance overall between dimensions that imply negative characteristics and which might attract unreliable disaquiescence and those which are more positively worded. For example, the dimension explored in the baseline enquiry of: 'students' spelling is generally poor' is rephrased in the Dyslexia Index Profiler to: 'My spelling is generally good'. Given poor spelling to be a typical characteristic of dyslexia in early-years writing, it would be expected that although many dyslexic students at university have improved spelling, it remains a weakness and many rely on technology-associated spellcheckers for correct spellings.
| item # | item statement | weighting |
| 3.01 | When I was learning to read at school, I often felt I was slower than others in my class | 0.80 |
| 3.02 | My spelling is generally very good | 0.53 |
| 3.03 | I find it very challenging to manage my time efficiently | 0.70 |
| 3.04 | I can explain things to people much more easily verbally than in my writing | 0.71 |
| 3.05 | I think I am a highly organized learner | 0.43 |
| 3.06 | In my writing I frequently use the wrong word for my intended meaning | 0.48 |
| 3.07 | I generally remember appointments and arrive on time | 0.64 |
| 3.08 | When I'm reading, I sometimes read the same line again or miss out a line altogether | 0.75 |
| 3.09 | I have difficulty putting my writing ideas into a sensible order | 0.76 |
| 3.10 | In my writing at school, I often mixed up similar letters like 'b' and 'd' or 'p' and 'q' | 0.80 |
| 3.11 | When I'm planning my work I use diagrams or mindmaps rather than lists or bullet points | 0.57 |
| 3.12 | I'm hopeless at remembering things like telephone numbers | 0.75 |
| 3.13 | I find following directions to get to places quite straightforward | 0.48 |
| 3.14 | I prefer looking at the 'big picture' rather than focusing on the details | 0.57 |
| 3.15 | My friends say I often think in unusual or creative ways to solve problems | 0.63 |
| 3.16 | I find it really challenging to make sense of a list of instructions | 0.52 |
| 3.17 | I get my 'lefts' and 'rights' easily mixed up | 0.52 |
| 3.18 | My tutors often tell me that my essays or assignments are confusing to read | 0.70 |
| 3.19 | I get in a muddle when I'm searching for learning resources or information | 0.64 |
| 3.20 | I get really anxious if I'm asked to read 'out loud' | 0.72 |
However it is recognized that designing questionnaire items in such a way as to best ensure the strongest veracity in responses can be challenging. Setting aside design styles that seek to minimize random error, the research literature reviewed appears otherwise inconclusive about the cleanest methods to choose and, significantly, little research appears to have been conducted about the impact of potentially confounding, latent variables hidden in response styles that may be dependent on questionnaire formatting (Weijters, et al, 2004). Although only possible post-hoc, analysis measures such as Cronbach's α can at least provide some idea about a scale's internal consistency reliability although at the level of this research project, it has not been possible to consider the variability in values of Cronbach's α that may arise through gaining data from the same respondents but through different questionnaire styles, design or statement wording. Nevertheless, this 'unknown' is recognized as a potential limitation of the data collection process that must be mentioned and these aspects of questionnaire design will be expanded upon in more detail in the final thesis.
Reverse coding data
Having a balance of positively and negatively-phrased statements brings other issues, especially when the data collected is numerical in nature and aggregate summary values are calculated. For each of the dimension statements either a high score was expected, indicating strong agreement with the statement, or a low score, conversely indicating strong disagreement, to be a marker of a dyslexic profile. Since the scale is designed to provide a numerical indicator of a 'dyslexia-ness', it seemed appropriate to aggregate the input-values that were recorded by respondents in such a way that a high aggregated score points towards a strong dyslexic profile. It had been planned to reverse code scores for some statements so that the overall calculation to the final Dyslexia Index would not be upset by high and low scores cancelling each other out where a high score for one statement and a low score for a different statement were each indicating a dyslexic profile. Below is the complete list of 20 statements showing whether a 'high score=strong agreement (H)' or a 'low score=strong disagreement (L)' was expected to be the dyslexic marker.
Thus for the statement: 'my spelling is generally good' where it is widely acknowledged that individuals with dyslexia tend to be poor spellers, a low score indicating strong disagreement with the statement would be the marker for dyslexia and so respondent values for this statement would be reverse-coded when aggregated into the final Dyslexia Index. However the picture that emerged for many of the other statements once the data had been collated and tabulated was less clear. To explore this further a Pearson Product-Moment Correlation was run to calculate values for the correlation coefficient, r, for each statement with the final aggregated Dyslexia Index (Dx). Although it is accepted that this is a somewhat circular process, since all of the statements being correlated with Dx are each part of the aggregated score that creates Dx, it was felt that exploring this may still provide a clearer picture for deciding which statements' data values should be reverse-coded and which others should be left in their raw form. It has only been possible to apply this analysis once all data has arrived from the deployment of the main research questionnaire (May/June 2016). In total, 166 complete questionnaire replies were received or which 68 included a declaration that the respondent had a formally identified dyslexic learning difference.
These correlation coefficients are presented in the table below. The deciding criteria used was this: if the expectation is to reverse-code a statement's data and this is supported by a strong negative correlation coefficient, hence indicating that statement is negatively correlated with Dx, then the reverse-coding process would be applied to the data. If the correlation coefficient indicates anything else – that is ranging from weak negative to strong positive – the data would be left as it is. H/L indicates whether a High or a Low score is expected to be a marker for dyslexia and 'RC' indicates a statement that is to be reverse-coded as a result of considering r.
It can been seen from the summary table that the only dimension that has eventually been reverse-coded has been dimension #2: 'my spelling is generally very good' as this was the only one that presented a high(ish) negative correlation with Dx of r = - 0.52. It of note that of the other dimensions that were suspected to require reverse-coding, their correlations with Dx is close to zero which suggests that either reverse-coding or not will make little appreciable difference to the aggregated final Dyslexia Index.
With the complete datapool now established from the 166 main research questionnaire replies received, it has been possible to look more closely at correlation coefficient relationships between the dimensions. A commentary on this is posted on the project's StudyBlog (post title: 'reverse coding') and a deeper exploration of these relationships is part of the immediate development objectives of this part of the project. It of note though, that by also running a Student's t-test for identifying differences between independent samples' means (at the 0.05 critical level, one-tail test ), for the mean value of each of the 20 dimensions in the Dyslexia Index Profiler between the two primary research groups (respondents with declared dyslexia, effectively the 'control' group, n=68 and the remaining respondents, assumed to have no formally identified dyslexia, n = 98), significant differences between the means were identified for 16 out of the 20 dimensions. The 4 dimensions where no significant difference occurred between the dimensions' sample means were:
- I find it very challenging to manage my time effectively; (t = -1.1592, p = 0.113)
- I think I am a highly organized learner; (t = -0.363, p = 0.717)
- I generally remember appointments and arrive on time; (t = 0.816, p = 0.416)
- I find following directions to get to places quite straightforward; (t = 0.488, p = 0.626)
... which is suggesting that these four dimensions are having little or no impact on the overall value of the Dyslexia Index (Dx) and that therefore these dimensions might be omitted from the final aggregated score. In fact these same four dimensions were identified through the Cronbach's Alpha analysis as being possibly redundant items in the scale (details below). T-test results for all the other 16 dimensions produced p-value results at very close to zero indicating very highly significant differences for each dimensions' mean values between the control group of dyslexic students and everyone else. So as mentioned below, in the first-stage development of the Dyslexia Index Profiler, these four dimensions have been removed, leaving a 16-item scale. In addition, data from this reduced scale has now been used to recalculate each respondent's Dyslexia Index where this is being used as the key discriminator to identity students with a dyslexia-like profile but who are not known to be dyslexic, and hence, to enable research groups' academic behavioural confidence to be compared.
Internal consistency reliability - Cronbach's α
 It has also now been possible to assess the internal consistency reliability of the Dyslexia Index Profiler using the 166 datasets that have been received with the data collated into the software application SPSS.
Cronbach's Alpha (α) is widely used to establish the supposed internal reliability of data collection scales. It is important to take into account, however, that the coefficient is a measure for determining the extent to which scale items reflect the consistency of scores obtained in specific samples and does not assess the reliability of the scale per se (Boyle et al, 2015) because it is reporting a feature or property of the individuals' responses who have actually taken part in the questionnaire process. This means that although the alpha value provides some indication of internal consistency it is not necessarily evaluating the homogeneity, that is, the unidimensionality of a set of items that constitute a scale.
Nevertheless and with this caveat in mind, the Cronbach's Alpha process has been applied to the scales in the datasets collected from student responses to the main research questionnaire using the 'Scale-Analyse' feature in SPSS.
It has also now been possible to assess the internal consistency reliability of the Dyslexia Index Profiler using the 166 datasets that have been received with the data collated into the software application SPSS.
Cronbach's Alpha (α) is widely used to establish the supposed internal reliability of data collection scales. It is important to take into account, however, that the coefficient is a measure for determining the extent to which scale items reflect the consistency of scores obtained in specific samples and does not assess the reliability of the scale per se (Boyle et al, 2015) because it is reporting a feature or property of the individuals' responses who have actually taken part in the questionnaire process. This means that although the alpha value provides some indication of internal consistency it is not necessarily evaluating the homogeneity, that is, the unidimensionality of a set of items that constitute a scale.
Nevertheless and with this caveat in mind, the Cronbach's Alpha process has been applied to the scales in the datasets collected from student responses to the main research questionnaire using the 'Scale-Analyse' feature in SPSS.
The α value for the Dyslexia Index (Dx) 20-item scale computed to α = 0.842 which seems to be indicating a high level of internal consistency reliability. According to Kline (1986) an alpha value within the range 0.3 < α < 0.7 is to be sought, with preferred values being closest to the upper limit in this range. Kline proposed that a value of α < 0.3 is indicating that the internal consistency of the scale is fairly poor whilst a value of α > 0.7 may be indicating that the scale contains redundant items whose values are not providing much new information. It is encouraging to note that the same, four dimensions as identified and described in the section above did emerge as the most likely, 'redundant' scale items, hence further validating the development of the reduced, 16-item scale for Dyslexia Index, as reported above. Additionally, an interesting paper by Schmitt (1996) highlights research weaknesses that are exposed by relying on Cronbach's Alpha alone to inform the reliability of questionnaires' scales, proposing that additional evaluators about the inter-relatedness of scale items should also be reported, particularly, inter-correlations. SPSS has been used to generate the α value for the Dx scale and the extensive output window that accompanies the root value also presents a complete matrix of inter-correlations. Providing the product-moment coefficient, r, this connects well with mention above about exploring the correlation inter-relationships between each of the dimensions being gauged in the Dyslexia Index Profiler as a future development. The full table of r values computed for the complete datapool is shown below which are the correlations between dyslexia dimension outputs from all 166 research participants.
On the basis of Kline's guidelines, the value of α = 0.842, possibly showing a suspiciously high level of internal consistency and hence, some scale-item redundancy. SPSS is very helpful as one of the outputs it can generate shows how the alpha value would change if specific scale items are removed. Running this analysis showed that for any single scale item that is removed, the corresponding revised values of alpha fell within the range 0.833 < α < 0.863 which, quite confusingly, is quite a tight range of α values and might be suggesting that in fact, all scale items are making a good contribution to the complete 20 scale-item value of α. It is intended to explore all this in more detail, especially by using SPSS to remove all of the 4, apparently redundant items to observe the impact that this has on the value of Cronbach's α.
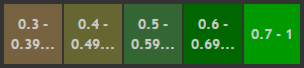


 |
0.635 | |||||||||||||||||||
 |
0.583 | 0.557 | ||||||||||||||||||
 |
0.478 | 0.498 | 0.488 | |||||||||||||||||
 |
0.433 | 0.621 | 0.433 | 0.583 | ||||||||||||||||
 |
0.406 | 0.418 | 0.400 | 0.513 | 0.356 | |||||||||||||||
 |
0.153 | 0.202 | 0.294 | 0.251 | 0.269 | 0.157 | ||||||||||||||
 |
0.255 | 0.272 | 0.264 | 0.363 | 0.335 | 0.365 | 0.310 | |||||||||||||
 |
0.379 | 0.369 | 0.339 | 0.549 | 0.492 | 0.420 | 0.310 | 0.456 | ||||||||||||
 |
0.231 | 0.267 | 0.295 | 0.454 | 0.368 | 0.248 | 0.272 | 0.216 | 0.396 | |||||||||||
 |
0.356 | 0.441 | 0.401 | 0.541 | 0.393 | 0.493 | 0.333 | 0.450 | 0.430 | 0.259 | ||||||||||
 |
0.395 | 0.445 | 0.405 | 0.517 | 0.567 | 0.310 | 0.353 | 0.335 | 0.507 | 0.362 | 0.469 | |||||||||
 |
0.153 | 0.401 | 0.382 | 0.409 | 0.474 | 0.307 | 0.310 | 0.329 | 0.392 | 0.337 | 0.539 | 0.353 | ||||||||
 |
0.017 | -0.018 | 0.011 | -0.048 | -0.201 | -0.113 | 0.014 | 0.022 | -0.048 | 0.035 | -0.029 | -0.166 | -0.225 | |||||||
 |
0.000 | 0.106 | 0.094 | 0.092 | 0.318 | -0.024 | 0.169 | 0.013 | 0.034 | 0.139 | 0.090 | 0.312 | 0.034 | -0.446 | ||||||
 |
-0.105 | -0.093 | -0.062 | 0.030 | -0.090 | -0.083 | -0.146 | -0.163 | -0.110 | 0.004 | -0.054 | -0.125 | -0.243 | 0.414 | -0.291 | |||||
 |
0.019 | 0.178 | 0.127 | 0.177 | 0.244 | 0.027 | 0.193 | 0.099 | 0.005 | 0.240 | 0.127 | 0.005 | 0.048 | 0.102 | 0.084 | 0.173 | ||||
 |
0.189 | 0.332 | 0.315 | 0.484 | 0.395 | 0.259 | 0.221 | 0.107 | 0.279 | 0.205 | 0.253 | 0.356 | 0.286 | -0.056 | 0.183 | 0.123 | 0.316 | |||
 |
-0.100 | -0.025 | -0.008 | -0.097 | 0.017 | -0.140 | 0.019 | -0.150 | -0.059 | 0.071 | -0.096 | -0.104 | -0.083 | 0.123 | -0.088 | 0.198 | 0.134 | -0.049 | ||
 |
0.331 | 0.360 | 0.365 | 0.319 | 0.349 | 0.296 | 0.134 | 0.306 | 0.207 | 0.160 | 0.352 | 0.306 | 0.333 | -0.041 | 0.190 | -0.181 | 0.151 | 0.225 | -0.191 |
The matrix of inter-correlations for the metric Dx does present a wide range of correlation coefficients (above). These range from r = -0.446, between scale item statements: 'I think I'm a highly organized learner' and 'I find it very challenging to manage my time efficiently' – which might be expected; to r = 0.635, between scale item statements: 'I get really anxious if I'm asked to read 'out loud' and 'When I'm reading, I sometimes read the same line again or miss out a line altogether' – which we also might expect.
This interesting spectrum of results has been explored in more detail through a Principal Component Analysis (PCA). When applied to these correlations coefficients to examine how highly correlated scale items might be brought together into a series of factors, five Dyslexia Index (Dx) factors did emerge from the PCA process and these were designated:
- Dx Factor 1: Reading, Writing, Spelling;
- Dx Factor 2: Thinking and Processing;
- Dx Factor 3: Organization and Time Management;
- Dx Factor 4: Verbalizing and Scoping;
- Dx Factor 5: Working Memory;
 The complete results of this process are reported in detail below, with some hypotheses on what these analysis outcomes may mean presented later in the 'Discussion' section of this thesis. However, the PCA process applied to the metric Dyslexia Index has enabled highly interesting visualizations of each research respondent's Dyslexia Index dimensional traits to be created. In the first of the three examples below we see the profile map for the dataset of one respondent overlaid onto the profiles of dimension mean values for each of the research subgroups of students with dyslexia and students with no dyslexia. In this first example, the respondent shown was from the non-dyslexic subgroup although this individual's Dyslexia Index (Dx), established from the Dyslexia Index Profiler being reported in this section, was at a value more in line with those research participants who had disclosed their dyslexia (Dx = 682.5, in comparison with the mean value for the subgroup of dyslexic students of Dx = 662.82, and of the subgroup of non-dyslexic students of Dx = 396.33). The radial axes are scaled from 0 to 100 and as can be seen, this respondent's profile is clearly skewed towards the mean dyslexic profile in the three sectors north-west to east (using a compass analogy) with additional close similarity with other dimensional markers. Setting aside the visual appeal of this presentation of this respondent's profile and the holistic overview of the spectrum of dimensions that it captures, it can be seen that as a broad indication of where this student is likely to be experiencing academic challenges, this representation of strengths and weaknesses could be of significant use to a university learning development and support professional who has been approached by this student for some help and guidance towards improving the quality of their academic output. The second and third examples are also profiles of students from the non-dyslexic subgroup but who present Dyslexia Index values of Dx = 708.6 and 655.3 respectively. These are provided to demonstrate examples of different dimensional profiles but which still aggregate to a Dyslexia Index that is close to the mean Dx value for the dyslexic subgroup. This appears to be adding substance to the argument that by looking at an individual's apparent dyslexia-ness on a dimension by dimension basis, a better understanding of how these dimensions may impact on their academic study regime and hence provide a valuable insight into developing effective learning scaffolds that might enable this learner to better understand their academic strengths and how these may be used to advantage whilst at the same time, create learning development strategies that reduce the impact of challenges. As a baseline reference, the mean Dyslexia Index for subgroup of dyslexic students was Dx = 662.84, and for the subgroup of non-dyslexic students, the mean was Dx = 396.33.
These dyslexia dimension profile visualizations are helpful for gaining a better understanding of how the different dimensions contribute to dyslexia-ness and a more analytic discussion about how these can be useful and can contribute to a better understanding about what dyslexia means in higher education learning contexts is presented as part of the discussion, below. Developing this profile visualization concept will be a project for further research where the focus will particularly be on creating a data connection infrastructure that can enable these profiles to be generated directly from a respondent's inputs on the Dyslexia Index Profiler, in itself for development at a later stage but which is presented in a very early pilot form here.
.
Reporting more than Cronbach's α
Further reading about internal consistency reliability coefficients has identified studies which firstly identify persistent weaknesses in the reporting of data reliability in research, particularly in the field of social sciences (eg Henson, 2001, Onwuegbuzie & Daniel, 2000, 2002). Secondly, useful frameworks are suggested for a better process for reporting and interpreting internal consistency reliability estimates which, it is argued, then present a more comprehensive picture of the reliability of data collection procedures, particularly data elicited through self-report questionnaires. Henson (op cit) strongly emphasizes the point that 'internal consistency coefficients are not direct measures of reliability, but rather are theoretical estimates derived from classical test theory' (2001, p177), which connects with Boyle's (2015, above) interpretation about the sense of this measure being relational to the sample from which the scale data is derived rather than directly indicative of the reliability of the scale more generally. However Boyle's view relating to the scale item homogeneity appears to be different from Henson's who, contrary to Boyle's argument, does state that internal consistency measures do indeed offer an insight into whether or not scale items are combining to measure the same construct. Henson strongly advocates that when (scale) item relationship correlations are of a high order, this indicates that the scale as a whole is gauging the construct of interest with some degree of consistency – that is, that the scores obtained from this sample at least, are reliable (Henson, 2001, p180). This apparent perversity is less than helpful and so in preparation for the final thesis of this research project, this difference of views needs to be more clearly understood and reported, a task that will be undertaken as part of the project write-up.
However at this stage, it has been found informative to follow some of these guidelines. Onwuegbuzie and Daniel (2002) base their paper on much of Henson's work but go further by presenting recommendations to researchers which proposes that they/we should always estimate and report:
- internal consistency reliability coefficients for the current sample;
- confidence intervals around internal consistency reliability coefficients – but specifically upper tail limit values;
- internal consistency reliability coefficients and the upper tail confidence value for each sample subgroup (ibid, p92)
The idea of providing a confidence interval for Cronbach's α is attractive, since, as being discussed here, we now know that the value of the coefficient is relating information about the internal consistency of scores for items making up a scale that pertains to that particular sample. Hence it then represents merely a point estimate of the likely internal consistency reliability of the scale, (and of course, the construct of interest), for all samples taken from the background population. But interval estimates are better, especially as the point estimate value, α, is claimed by Cronbach himself in his original paper (1951) to be most likely a lower-bound estimate of score consistency, implying that the traditionally calculated and reported single value of α is likely to be an under-estimate of the true internal consistency reliability of the scale were it to be applied to the background population. So Onwuegbuzie and Daniel's suggestion that one-sided confidence intervals (the upper bound) are reported in addition to the value of Cronbach's α is a good guide for more comprehensively reporting the internal consistency reliability of data because it is this value which is more likely to be close to the true value.
Calculating the upper-limit confidence value for Cronbach's α
Confidence intervals are most usually specified to provide an interval estimate for the population mean using sample data to do this by using a sample mean – which is a point estimate for the population mean – and building the confidence interval estimate based on the assumption that the background population follows the normal distribution. So it follows that any point estimate of a population parameter might also have a confidence interval estimate constructed around it provided we can accept the most underlying assumption that the distribution of the parameter is normal. For a correlation coefficient between two variables in a sample, this is a point estimate of the correlation coefficient between the two variables in the background population and if we took a separate sample from the population we might expect a different correlation coefficient to be produced although there is a good chance that it would be of a similar order. Hence a distribution of correlation coefficients would emerge, much akin to the distribution of sample means that constitutes the fundamental tenet of the Central Limit Theorem and which permits us to generate confidence intervals for a background population mean based on sample data.
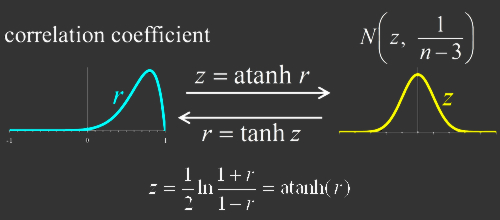 Fisher (1915) explored this idea to arrive at a transformation that maps the Pearson Product-Moment Correlation Coefficient, r , onto a value, Z’, which he showed to be approximately normally distributed and hence, confidence interval estimates could be constructed. Given that Cronbach’s α is essentially based on values of r, we can use Fisher’s Z’ to transform Cronbach’s α and subsequently apply the standard processes for creating our confidence interval estimates for the range of values of α we might expect in the background population. Fisher showed that the standard error of Z’, which is obviously required in the construction of confidence intervals, to be solely related to the sample size: SE = 1/√(n-3), with the transformation process for generating Z’ shown in the graphic (right).
So now the upper-tail 95% confidence interval limit can be generated for Cronbach alpha values and to do this, the step-by-step process described by Onwuegbuzie and Daniel (op cit) was worked through by following a useful example of the process outlined by Lane (2013):
- Transform the value for Cronbach's α to Fisher's Z'
- Calculate the Standard Error (SE) for Z'
- Calculate the upper 95% confidence limit for Z' + (SE)*Z [for the upper tail of 95% two-tail confidence interval, Z = 1.96]
- Transform the upper confidence limit for Z' back to a Cronbach's α internal consistency reliability coefficient.
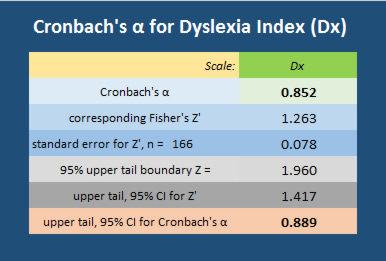 A number of online tools for transforming to Fisher's Z' were found but the preference has been to establish this independently in Excel using the z-function transformation shown in the graphic above. The table (right) shows the set of cell calculation step-results from the Excel spreadsheet and particularly, the result for the upper 95% confidence limit for α for the Dyslexia Index Profiler scale (α = 0.889). So this completes the first part of Onwuegbuzie & Daniel's (2002) additional recommendation by reporting not only the internal reliability coefficient, α, for the Dyslexia Index Profiler scale, but also the upper tail boundary value for the 95% confidence interval for α.
The second part of their suggested improved reporting of Cronbach's α requires the same parameters to be reported for the subgroups of the main research group. In this study the principle subgroups divide the complete datapool into student respondents who declared their existing identification of dyslexia and those others who indicated that they had no known learning challenges such as dyslexia. As detailed on the project's webpages , these research subgroups are designated research group DI (n = 66) and research group ND (n = 98) respectively. SPSS has then been used again to analyse scale reliability and the Excel spreadsheet calculator function has generated the upper tail 95% CI limit for α. Results are shown collectively in the table (right, and below).
These tables show the difference in the root values of α for each of the research subgroups: Dx - ND, α = 0.842; Dx - DI, α = 0.689. These are both 'respectable' values for Cronbach's α coefficient of internal consistency reliability although at the moment I cannot explain why the value of α = 0.852 for the complete research datapool is higher than either of these values, which is puzzling. This will be explored later and reported. However, it is clear to see that, assuming discrepancies are resolved with a satisfactory explanation, the upper tail confidence interval boundaries for not only the complete research group but also both subgroups all present an α value that indicates a strong degree of internal consistency reliability for the Dyslexia Index scale, notwithstanding Kline's earlier caveats mentioned above.
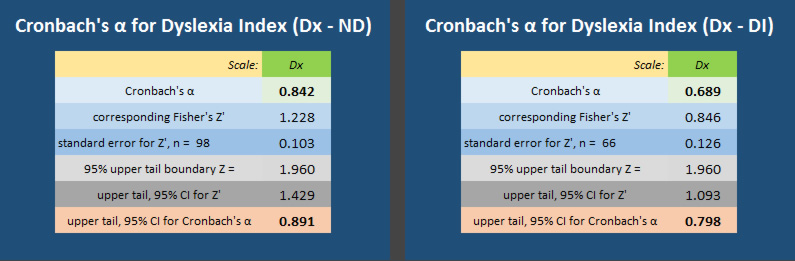
Preliminary data analysis outcomes
Following deployment of the main research questionnaire during the Summer Term 2016, 183 responses were received of which 17 were discarded because they were less than 50% completed or 'spoiled' in some other way. The remaining 166 datasets are collectively referred to as the datapool. Of the 166 'good' datasets, 68 were from students with dyslexia leaving a remainder of 98 from students who indicated no learning challenges (n = 81) or indicated a learning challenge other than dyslexia (n=17). The table below presents the initial results for the metric Dyslexia Index (Dx):
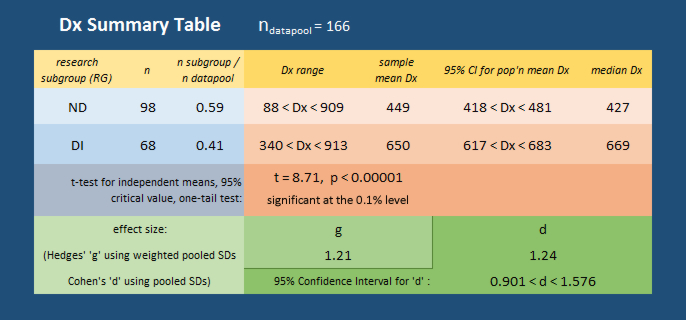
It can be seen that there are significant differences in Dx values for the two primary research subgroups, notably:
- both the sample mean Dx and median Dx for the subgroup ND are much lower than for the subgroup DI.
- Student's t-test for a difference between independent sample means was conducted on the complete series of datasets for each subgroup with the parameters set as a one-tail test - because the test was to see if the sample mean Dyslexia Index for students who offered no declaration of dyslexia is significantly lower than the sample mean Dx for students who were declaring dyslexia - and the test set at the conventional 95% critical value.
It can be seen that the resulting value of t = 8.71 generated a 'p' value of < 0.00001 which is indicating a level of significance that is off the scale. However, Levene's test for homogeneity of variances was violated (p = 0.009) although the alternative Welch's t-test, to be used when population variances are estimated to be different, returned t = 9.301, p < 0.00001 which is similarly indicating a significant difference between the mean values of Dx.
This was the expected result and on this judgment at least, appears to be indicating that the Dyslexia Index metric is clearly identifying dyslexia, at least according to the criteria applied in this project. - Additionally, the Hedges' 'g' effect size result of g = 1.21 is indicating a large to very large effect size for the sample means (Sullivan & Feinn, 2012). Hedges' 'g' is preferred as although it is based on Cohen's 'd', its calculation uses a weighted, pooled standard deviation based on the sample sizes which is considered to be better when the sample sizes are not close.
- Cohen's 'd' effect size is also calculated as it is possible to create a confidence interval estimate for the Cohen's 'd' effect size for the population (Cumming, 2010), so together with Hedges' 'g', these are also indicating that there is a strong liklihood of significant differences between the Dyslexia Index of students with reported dyslexia and those without. Thus for the purposes of this research project, the Dyslexia Index Profiler is a good discriminator.
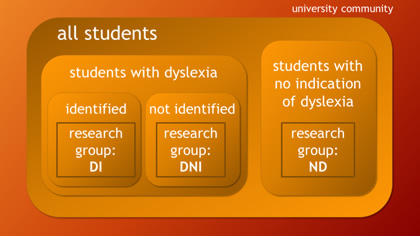 The Dyslexia Index Profiler has been developed to enable discrimination to be applied within the research group ND data to search for QNR respondents who appear to be presenting an unidentified dyslexic profile. This is a key process of the whole research project as it subsequently establishes a fresh research sub-group, designated research group 'DNI', of students with dyslexic-like profiles but who are not formally identified as dyslexic. Clearly the summary table above appears to be indicating that there are students with a high Dx value in the non-dyslexic subgroup, ND, which is exactly what the profiler set out to establish.
So the complete datapool can now be sub-divided further into three research subgroups:
The Dyslexia Index Profiler has been developed to enable discrimination to be applied within the research group ND data to search for QNR respondents who appear to be presenting an unidentified dyslexic profile. This is a key process of the whole research project as it subsequently establishes a fresh research sub-group, designated research group 'DNI', of students with dyslexic-like profiles but who are not formally identified as dyslexic. Clearly the summary table above appears to be indicating that there are students with a high Dx value in the non-dyslexic subgroup, ND, which is exactly what the profiler set out to establish.
So the complete datapool can now be sub-divided further into three research subgroups:
- Research group: DI - these are students who have declared in their questionnaire responses that they have an identified dyslexic learning difference.
- Research group: ND - these are students who have not declared that they have an identified dyslexic learning difference and who have indicated that they have no other learning challenges or they have chosen some other learning challenge from a list (eg: 'ADHD', 'dyspraxia', 'something else').
- Research subgroup DNI - this is a subgroup of students from research group ND who have been filtered out using the Dyslexia Index Profiler and is the research group of particular interest to the project.
Labelling research groups can get confusing, as in this project, filtering processes are used to group datasets into subgroups. Although it is recognized that the main groups of interest, that is students with identified dyslexia (DI) and students without (ND) are actually sub-groups of the complete datapool of all students, so as to avoid speaking of sub-sub-groups, the two principal subgroups, DI and ND, will be referred to simply as research groups so that subgroups of these can be more easily designated.
Setting boundary values for Dx
The next task has been to decide on a boundary value for Dyslexia Index in research group ND that acts to filter out student responses in this group into the subgroup DNI. As the data analysis process has progressed, a critical evaluation of the setting of boundary values has been applied. At the outset a cursory inspection of the data suggested that setting Dx = 600 as the filter seemed appropriate. Doing so generated a dataset subgroup of n=17 respondents with no previously reported dyslexia but who appeared to be presenting dyslexia-like characteristics in their study profiles. Although this generated a subgroup of small sample size which it is acknowledged, does impact on statistical processes that are applied, this sample subgroup DNI (n=18) does represent a sizeable minority of the background sample group ND (n=98) from which it is derived. In other words, it is indicating that nearly 20% of the non-dyslexic students who participated in the research appear to be presenting unidentified dyslexia-like profiles which is consistent with widely reported research suggesting that the proportion of known dyslexics studying at university is likely to be significantly lower than the true number of students with dyslexia or dyslexia-like study characteristics (eg: Richardson & Wydell, 2003, MacCullagh et al, 2016, Henderson, 2017). Equally, setting a lower boundary value of Dx = 400 has been useful for establishing an additional comparator subgroup of students from research group ND who are highly unlikely to be presenting unidentified dyslexia - this subgroup designated: ND-400. Although subsequently adjusted (see below) the opening analysis rationale for setting these boundary values has been:
| Research Group | Research SubGroup | Criteria |
| ND | ND-400 | students in research group ND who present a Dyslexia Index (Dx) of Dx < 400 |
| DNI | students in research group ND who present a Dyslexia Index of Dx > 600 - this is the group of greatest interest | |
| DI | DI-600 | students in research group DI who present a Dyslexia Index of Dx > 600 - this is the 'control' group |
The graphic below supports these boundary value conditions by presenting the basic statistics for each of the research groups and subgroups including confidence interval estimates for the respective population mean Dx values. On this basis it was felt that setting Dx filters at Dx = 400 and Dx = 600 were reasonable. Note particularly the lower, 99% confidence interval boundary for the population mean Dx for students with identified dyslexia falls at Dx = 606, and respective 99% lower CI boundary for students with no previously reported dyslexia falls at Dx = 408. (Note that research subgroup DNI, as established from these criteria, is not shown in this graphic but this group presented a mean Dx = 690, and 99% CI for μ of 643 < Dx < 737).
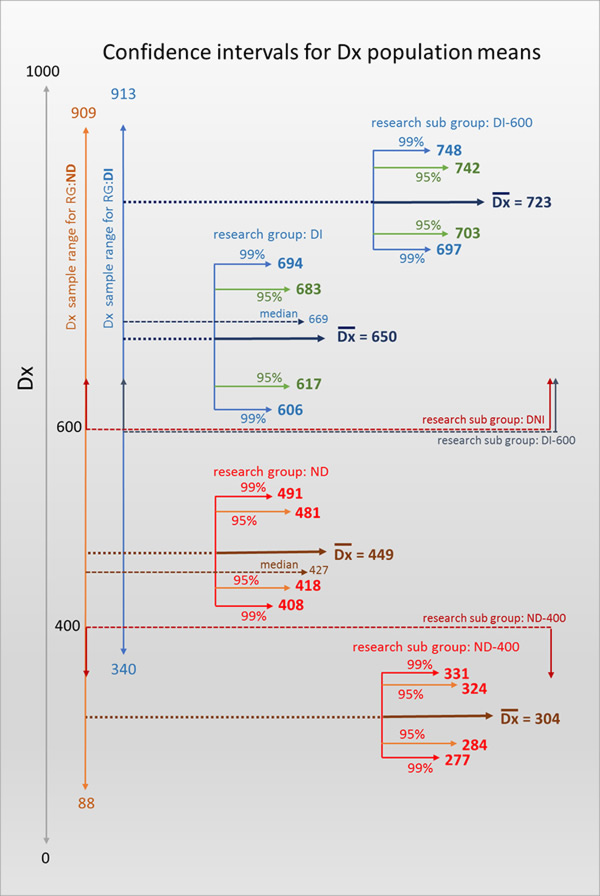
However, in order for the Academic Behavioural Confidence for the subgroups to be justifiably compared, particularly ABC values for the subgroups of students with identified dyslexia from the dyslexic group presenting Dx > 600, and students presenting dyslexia-like profiles from the non-dyslexic group by virtue their Dyslexia Index values also being Dx > 600, it is important for the key parameter of Dyslexia Index for each of these two subgroups to be close enough for us to be able to say, statistically at least, that the mean Dyslexia Index for the two groups is the same. Hence with research subgroup DNI presenting a mean Dx = 690, some 33 Dx points below the mean for research subgroup DI-600, it was felt necessary to conduct a t-test for independent sample means to establish whether this sample mean Dx = 690 is significantly different from the sample mean Dx = 723 for research subgroup DI-600. If not, then the boundary value of Dx = 600 remains a sensible one for sifting respondents into research subgroup DNI, however if there is a significant difference between these sample means then this is suggesting that the two subgroups are not sharing the similar (background population) characteristic of mean Dx and hence other comparison analysis of attributes between these two research subgroups could not be considered so robustly.
Thus conducting a Student’s t-test for independent sample means, set at the conventional 5% level and as a one-tail test because it is known that the sample mean for research subgroup DI-600 is higher rather than merely different from that for research subgroup DNI, the outcome returned values of t = 1.6853, p = 0.0486 (calculation source here) indicating that there is a significant difference between the sample means of the two research subgroups, albeit only just. Following several further iterations of the t-test based on selecting different boundary Dx values close to Dx = 600, an outcome that is considered satisfactory has been established using a boundary value of Dx = 592.5. This returned a t-test result of t = 1.6423, p = 0.05275 which now suggests no statistically significant difference between the sample means, although again, this p-value is only just above ‘not significant’ boundary value of the test.
The impact of this adjustment has been to increase the sample sizes of research subgroup DNI from n=17 to n=18, and of research subgroup DI-600 from n = 45 to n = 47 due to a slight shift in the datasets now included in the fresh groupings. Note too, the small differences in the means and CIs for these two research subgroups which is due to the revised sample sizes. The graphic below reflects all of these small differences and we can now clearly identify all of the research subgroups that will be discussed throughout the remainder of the thesis:
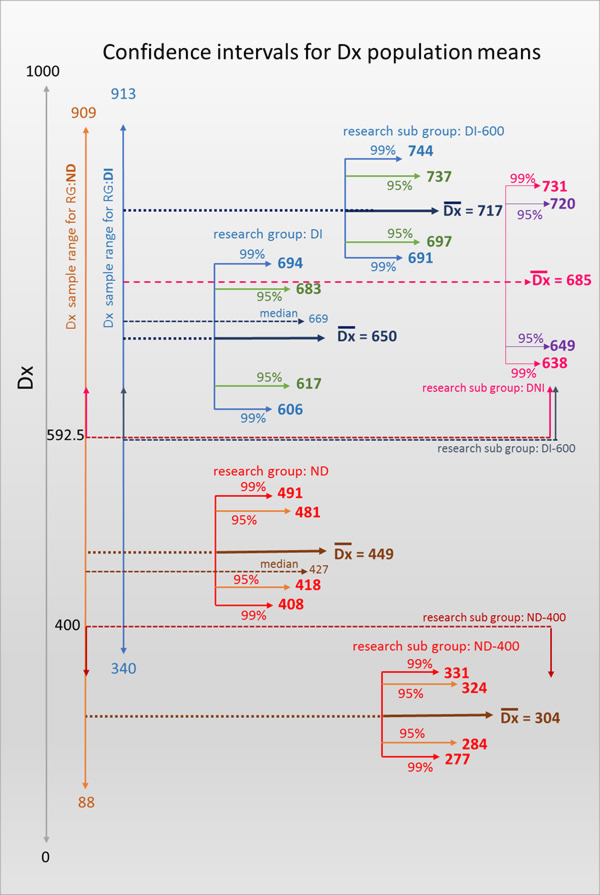
In order to avoid labelling confusion it is felt that although the most important Dx boundary value has shifted to Dx = 592.5, research subgroup designations will remain annotated as '##600'. The summary table (below) sets out all of the research subgroups and their designations including additional minor subgroups that will be referred to occassionally throughout the discussion section of the final thesis. It is important to reiterate that the principal Academic Behavioural Confidence comparison will be between research subgroups ND-400, DNI and DI-600.
| Research Group | Research SubGroup (n) | Criteria |
| ND | ND-400 (44) | students in research group ND who present a Dyslexia Index (Dx) of Dx < 400 |
| NDx400 (36) | students in research group ND who present a Dyslexia Index (Dx ) of 400 < Dx < 592.5 | |
| DNI (18) | students in research group ND who present a Dyslexia Index of Dx > 592.5 - this is the group of greatest interest | |
| DI | DI-600 (47) | students in research group DI who present a Dyslexia Index of Dx > 592.5 - this is the 'control' group |
| DIx600 (19) | students in research group DI who present a Dyslexia Index of 400 < Dx < 592.5 | |
Close inspection of the datasets however, also revealed a number of students in research group ND who presented a Dyslexia Index of between Dx = 400 and Dx = 592.5 which is interesting because these respondents are presenting what appears to be a kind of 'partial' dyslexia. This research subgroup is designated NDx400 (n = 36). This is interesting when taken with the 18 of the 68 students in research group DI - the students who had declared their dyslexia - who also returned a Dx value of between 400 and 592.5 (n = 19). Only two respondents in research group DI returned Dx values of Dx < 400 (339.92, 376.31) and these will be considered as outliers. But it was felt that this 'grey' group of apparently partial dyslexics, both previously identified, and not, deserve more scrutiny to see if other characteristics identified from scores in the other metrics in this project are also shared or whether other interesting differences emerge. [This is will be part of the deeper analysis of the data in due course and fully reported in the final thesis.]
[11555 / 63,074 (at 08 Jan 2018)]
Methods
Sed in consectetur leo, quis venenatis velit. Vivamus ipsum ante, rutrum eu urna consectetur, tempus dapibus augue. Nulla facilisi. Nullam quis orci sed dui ultricies finibus eu ut libero. Quisque in tempus lectus, et fermentum ligula. Nullam ullamcorper aliquam elit, at rutrum eros semper ut. Curabitur ut malesuada libero.
![]()
Results and Analysis
![]()
Results
Sed in consectetur leo, quis venenatis velit. Vivamus ipsum ante, rutrum eu urna consectetur, tempus dapibus augue. Nulla facilisi. Nullam quis orci sed dui ultricies finibus eu ut libero. Quisque in tempus lectus, et fermentum ligula. Nullam ullamcorper aliquam elit, at rutrum eros semper ut. Curabitur ut malesuada libero.
![]()
Results overview
Sed in consectetur leo, quis venenatis velit. Vivamus ipsum ante, rutrum eu urna consectetur, tempus dapibus augue. Nulla facilisi. Nullam quis orci sed dui ultricies finibus eu ut libero. Quisque in tempus lectus, et fermentum ligula. Nullam ullamcorper aliquam elit, at rutrum eros semper ut. Curabitur ut malesuada libero.
![]()
Analysis
Sed in consectetur leo, quis venenatis velit. Vivamus ipsum ante, rutrum eu urna consectetur, tempus dapibus augue. Nulla facilisi. Nullam quis orci sed dui ultricies finibus eu ut libero. Quisque in tempus lectus, et fermentum ligula. Nullam ullamcorper aliquam elit, at rutrum eros semper ut. Curabitur ut malesuada libero.
![]()
Analysis overview
Sed in consectetur leo, quis venenatis velit. Vivamus ipsum ante, rutrum eu urna consectetur, tempus dapibus augue. Nulla facilisi. Nullam quis orci sed dui ultricies finibus eu ut libero. Quisque in tempus lectus, et fermentum ligula. Nullam ullamcorper aliquam elit, at rutrum eros semper ut. Curabitur ut malesuada libero.
![]()
Discussion
This section will open with a review summary of the results of the quantitative analysis which demonstrates that there is a measurable difference in Academic Behavioural Confidence between not only students with dyslexia and those with no indications of dyslexia, but also between those with identified dyslexia and the small group who presented dyslexia-like profiles, aligned with those of the dyslexic group.
A key analysis concept for inclusion in the discussion section is Klassen's idea about calibration and his key paper (2002) will form an important basis for this.
![]()
Discussion overview
Sed in consectetur leo, quis venenatis velit. Vivamus ipsum ante, rutrum eu urna consectetur, tempus dapibus augue. Nulla facilisi. Nullam quis orci sed dui ultricies finibus eu ut libero. Quisque in tempus lectus, et fermentum ligula. Nullam ullamcorper aliquam elit, at rutrum eros semper ut. Curabitur ut malesuada libero.
![]()
Limitations
Sed in consectetur leo, quis venenatis velit. Vivamus ipsum ante, rutrum eu urna consectetur, tempus dapibus augue. Nulla facilisi. Nullam quis orci sed dui ultricies finibus eu ut libero. Quisque in tempus lectus, et fermentum ligula. Nullam ullamcorper aliquam elit, at rutrum eros semper ut. Curabitur ut malesuada libero.
![]()
Conclusions
Sed in consectetur leo, quis venenatis velit. Vivamus ipsum ante, rutrum eu urna consectetur, tempus dapibus augue. Nulla facilisi. Nullam quis orci sed dui ultricies finibus eu ut libero. Quisque in tempus lectus, et fermentum ligula. Nullam ullamcorper aliquam elit, at rutrum eros semper ut. Curabitur ut malesuada libero.
![]()
Directions for future research
Sed in consectetur leo, quis venenatis velit. Vivamus ipsum ante, rutrum eu urna consectetur, tempus dapibus augue. Nulla facilisi. Nullam quis orci sed dui ultricies finibus eu ut libero. Quisque in tempus lectus, et fermentum ligula. Nullam ullamcorper aliquam elit, at rutrum eros semper ut. Curabitur ut malesuada libero.
![]()
Presentation: ![]()
|
References
Ackerman, B.P., Izard, C.E., Kobak, R., Brown, E.D., Smith, C., 2007, Relation between reading problems and internalizing behaviour for preadolescent children from economically disadvantaged families, Child Development, 78(2), 581-596. |
||
| +44 (0)79 26 17 20 26 | www.ad1281.uk | ad1281@live.mdx.ac.uk | This page last edited: February 2018 |